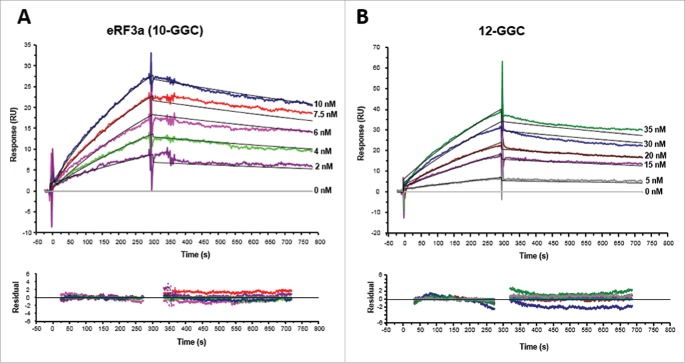
Figure 4.
Kinetic analyses of eRF3a 10-GGC allele (A) and eRF3a 12-GGC allele (B) interacting with PABP (300 RU) bound to OligoA120 RNA (30 RU) immobilized onto a SA sensor chip surface. Typical sensorgrams and fitting of the binding profiles to a Langmuir 1:1 binding model (top panel) and residuals plots (bottom panel) are shown. Concentrations of injected analytes are indicated on the right of the sensorgrams. For each analyte concentration the fitted curve is shown in black.

