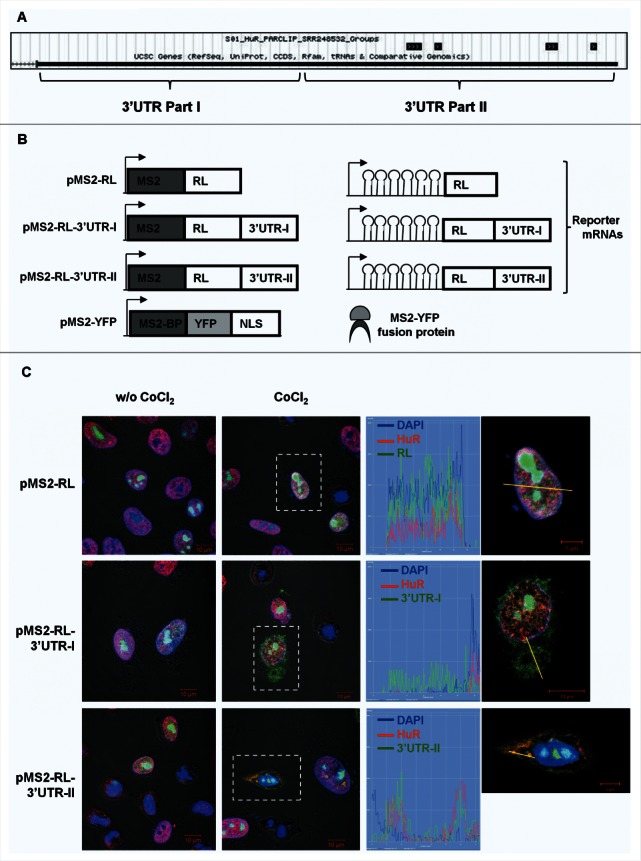
Figure 5.

(A) Sites of HuR interaction with VEGFA mRNA as determined by PAR-CLIP analysis (Lebedeva et al., 2011). (B) Schematic representation of the plasmids used for the intracellular tracking of VEGFA mRNA (left panel). pMS2-RL, pMS2-RL-3′UTR-I and pMS2-RL-3′UTR-II were derived from pSL-MS2(24X), and each expressed the Renilla luciferase (RL) coding region and 24 tandem MS2 RNA hairpins; pMS2-RL-3′UTR-I and pMS2-RL-3′UTR-II additionally contained VEGFA 3′UTR. The plasmid pMS2-YFP expressed a fusion fluorescent protein (MS2-YFP) capable of binding MS2-containing RNA (right panel). NLS, nuclear localization signal. (C) Representative confocal fluorescence micrographs of HeLa cells to visualize HuR (using anti-HuR antibody, red) and nuclei (using DAPI, blue). YFP fluorescence is green. Merged panels show co-localization of MS2-tagged RNAs and HuR, or MS2-tagged RNAs in the cytoplasm. Magnification, 40×. Untreated (w/o CoCl2) and CoCl2-treated cells are shown. Graphs depict the quantification of single-cell signal intensities in the segment indicated (yellow lines).
