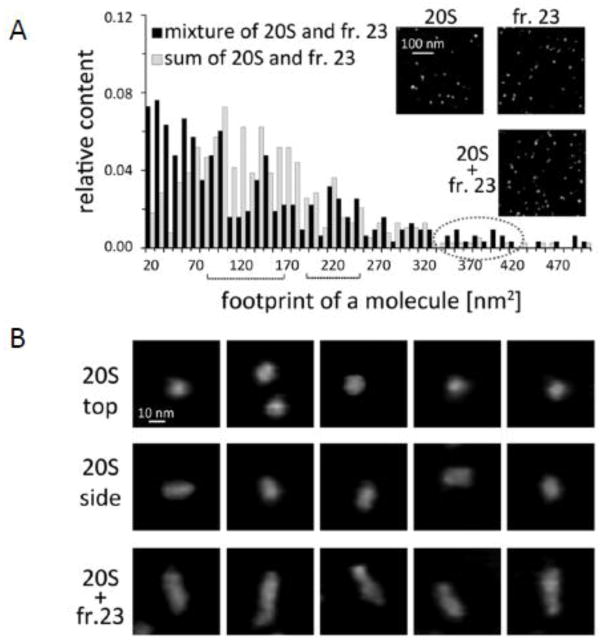
FIGURE 11. Atomic force microscopy [AFM] imaging identified putative complexes between proteasome and resistance factor.
(A) Frequency histogram of footprint area of the AFM detected particles in a mixture of purified h20S proteasome with a gel filtration fr. 23 containing resistance factor (black columns) and algebraic sum of the particle counts obtained separately with purified h20S proteasome and fr. 23 (gray columns). Inserts show AFM images of particle fields representing h20S, fr. 23 and their mixture (B) A gallery of representative images of particles zoomed-in from the fields of h20S (top-view and side-view) and h20S – fr. 23 mixture. The elongated molecules representing presumed proteasome-resistance factor complexes form the new class of particles, which appeared only when h20S was mixed with fr. 23. Tapping mode in liquid was used to collect height images (see Methods). The grey scale in all AFM images represents height of the particles, with black color corresponding to the background (0 nm) and white color corresponding to 20 nm. A gray dot line oval marks bins comprising a new class of particles present only in the mixture and centered around 360–380 nm2 (3B, bottom row). Black braces indicate ranges of area sizes characteristic for upright (A, left brace; B top row) and lying side view (A, right brace B middle row) h20S. Between 200 and 300 particles were analyzed for each case. Relative abundance of the new complexes in the mixture was 4.7% and average size of particles was 33x10nm (length x width). Inserts show fragments of AFM images of fields with respective particles.

