
Figure 3.
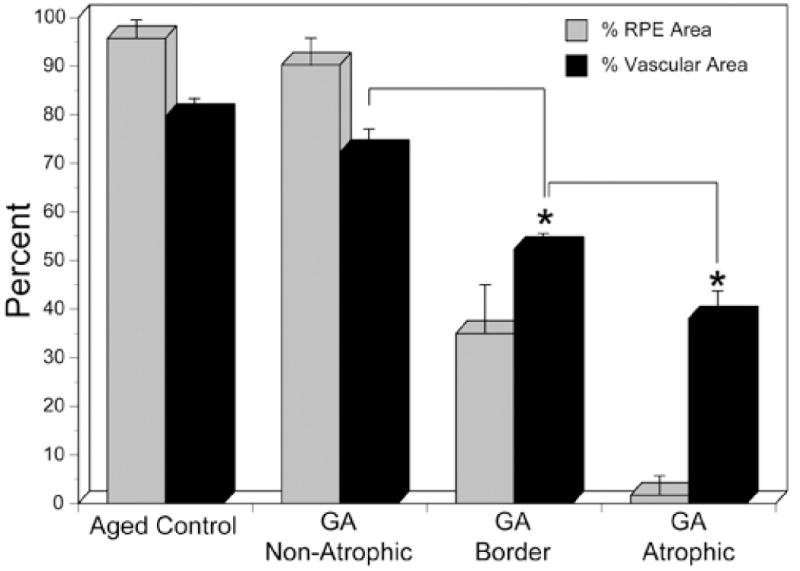
Comparison of percent RPE area and percent vascular area in aged control subjects and in the three regions analyzed in geographic atrophy choroids (GA). There was no statistically significant difference between aged control and nonatrophic regions of GA eyes in terms of RPE area (p=0.292) or vascular area (p=0.067). However, in GA choroid, there was a statistically significant decrease in both RPE (<0.0001) and vascular area (p=0.0001) in the border region compared to the nonatrophic region (asterisk). Similarly, there was a significant decrease in the RPE area (<0.0001) and vascular area (p=0.0013) in the atrophic region compared to the border region (asterisk).