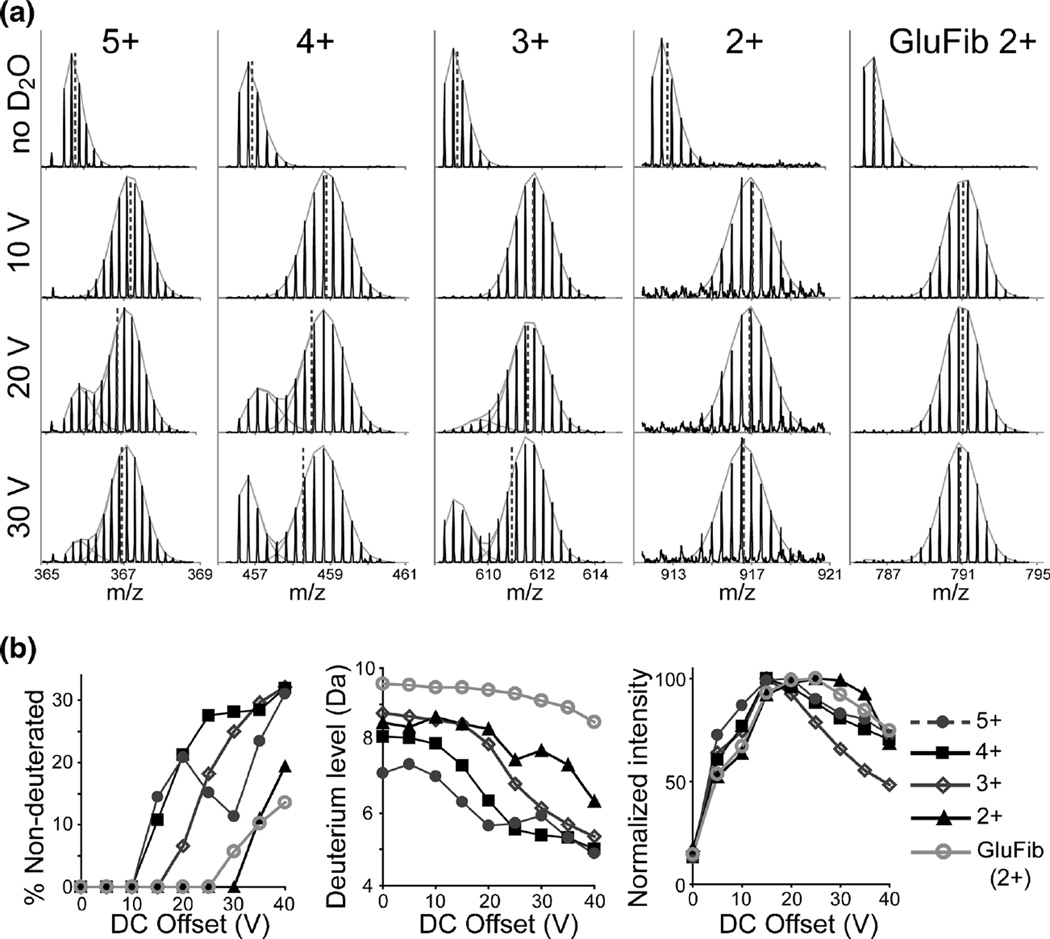
Figure 2.
Effect of the StepWave DC offset potential on deuterium loss. (a) Mass spectra of the 5+, 4+, 3+, 2+ charge states of synthetic peptide Env 497–511 (APTKAKRRVVQREKR) and the 2+ ion of GluFib. Spectra for the undeuterated form (at top) and maximally deuterated states with various StepWave DC offsets (10, 20, or 30 V) are shown. Dashed lines show the position of the centroid, and gray fits show the binomial distributions used to estimate the content of non-deuterated species. (b) Percent of the nondeuterated population (left), overall deuterium level (center), and the normalized signal intensity (right) as a function of DC offset voltage for various charge states

