Figure 2. RA gradients are noisy in space and time.
(A, B) Spatial noise. Plots show relative abundance of RA in five parallel rows of cells (each color corresponds to a different row) along the A-P axis of the neural ectoderm within a single embryo. (A) Experimental – each point represents the integrated signal of 40 consecutive FLIM measurements (2.7 min) (solid line represents best fit). (B) Computational – line represents the mean of 500 model simulations. (C, D) Temporal noise. Graphs show variability in relative abundance of RA in five single cells (each color corresponds to a different cell) at equivalent A-P positions over time. (C) Experimental – FLIM measurements were taken every 12 s. (D) Computational – colors correspond to individual cells for each stochastic realization. See also Supplementary file 1.

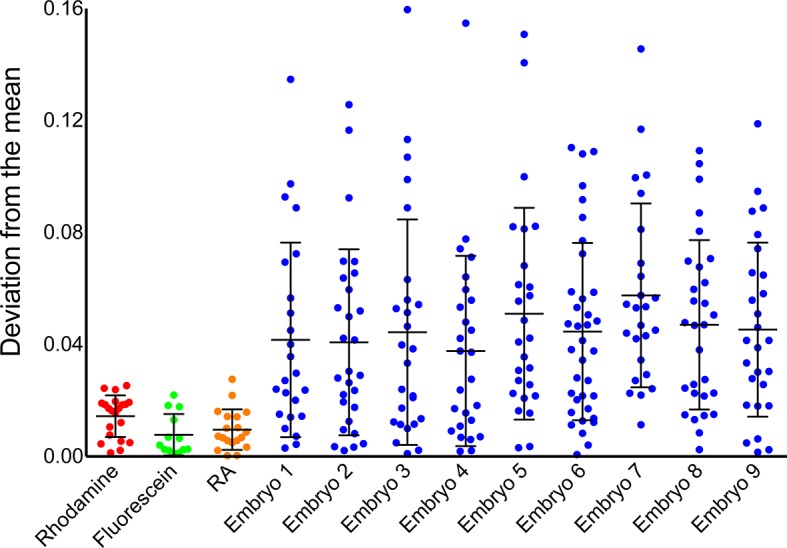
Figure 2—figure supplement 1. Instrument noise cannot account for noise in phasor-FLIM measurements of RA.