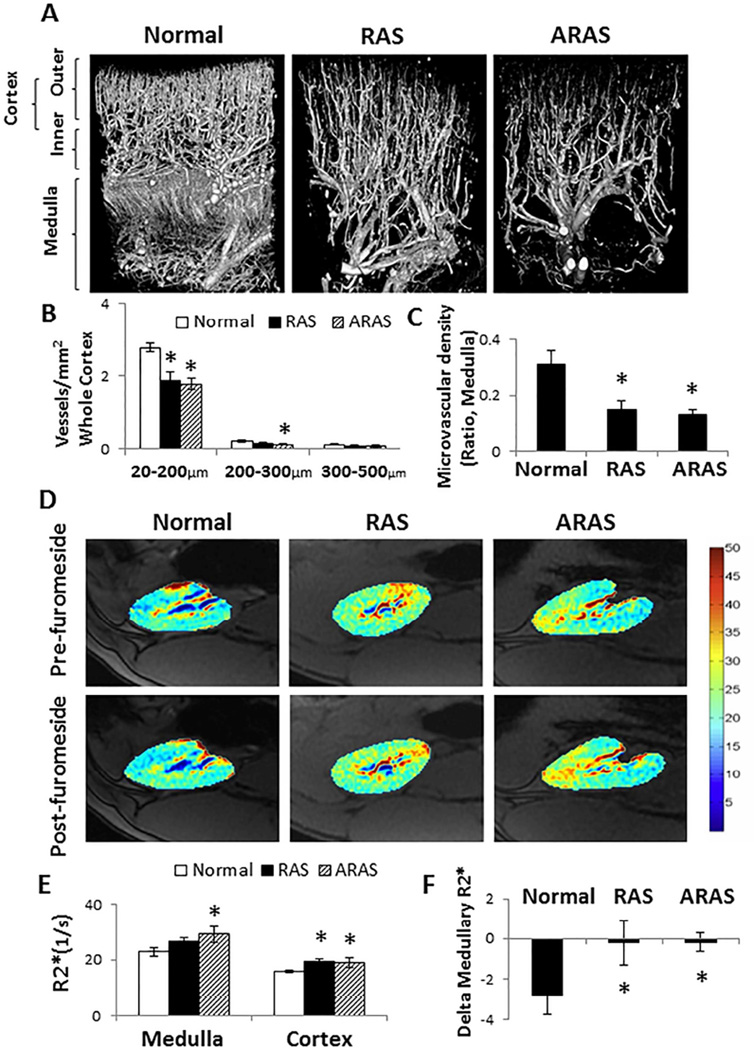
Figure 1.
Renal microvasculature and oxygenation in Normal, renal artery stenosis (RAS), and atherosclerotic RAS (ARAS) pigs. A. Representative micro-CT images. B. In the renal cortex, RAS decreased the density of small-sized microvessels (<200 µm) throughout the whole cortex, while ARAS decreased the density of both small and medium-sized (200–300 µm) microvessels. C. Medullary microvessels decreased in both RAS and ARAS compared with Normal. D. Representative BOLD images. E. Basal renal cortical R2* increased in both RAS and ARAS compared with Normal, but medullary R2* were only elevated in ARAS. F. The medullary R2* response to furosemide was blunted in both RAS and ARAS. *P<0.05 vs. Normal; #P<0.05 vs. RAS.

