Figure 2.
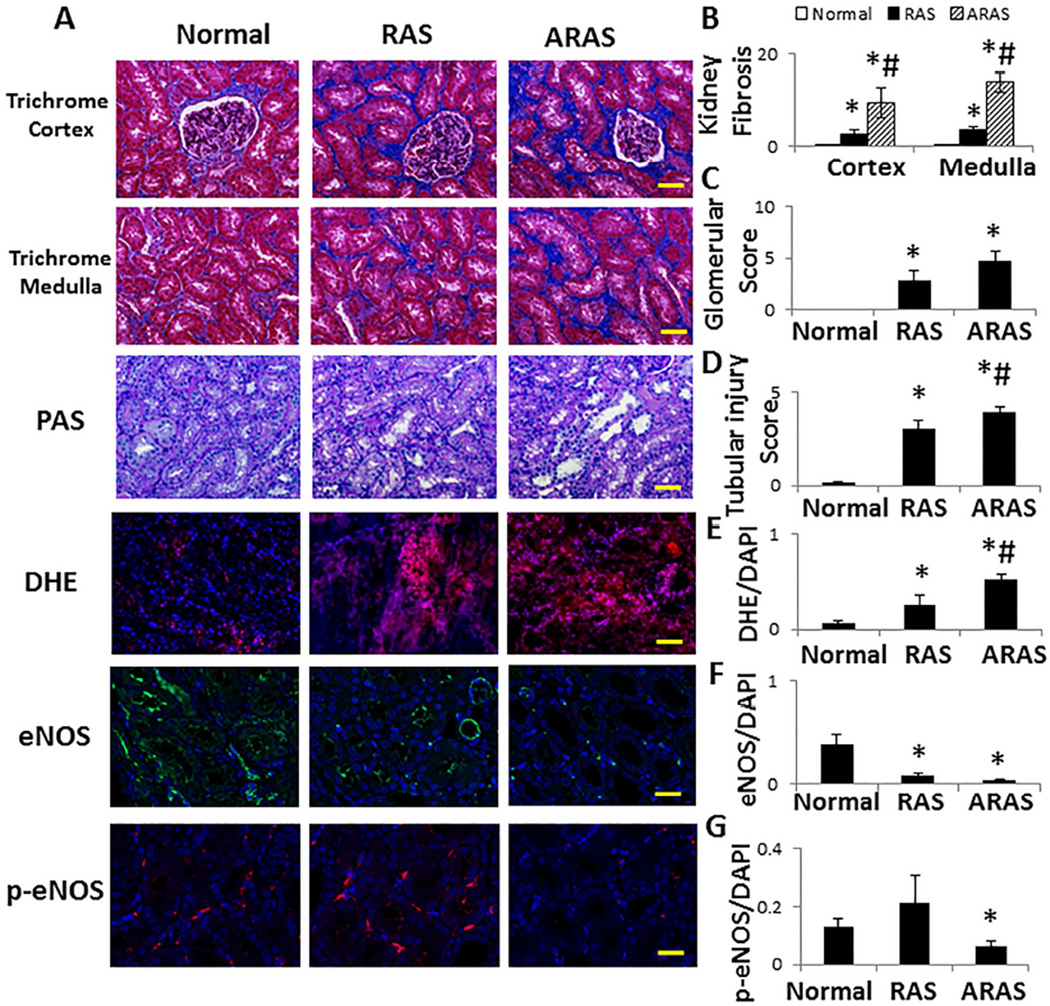
Renal tissue remodeling. A. Representative renal trichrome, dihydroethidium (DHE), eNOS and p-eNOS immunofluorescence (all ×20). B. Renal cortical and medullary fibrosis increased in RAS compared with Normal, and aggravated in ARAS. C. Glomerular score increased in RAS and ARAS. D. Tubular injury score increased in RAS, and further aggravated in ARAS. E. DHE staining (normalized to DAPI-positive nuclei) increased in RAS compared with Normal, and in ARAS compared with Normal and RAS. F–G. eNOS expression decreased in RAS and ARAS compared with Normal, but p-eNOS only decreased in ARAS. *P<0.05 vs. Normal; #P<0.05 vs. RAS. Scale bar=50 µm.

