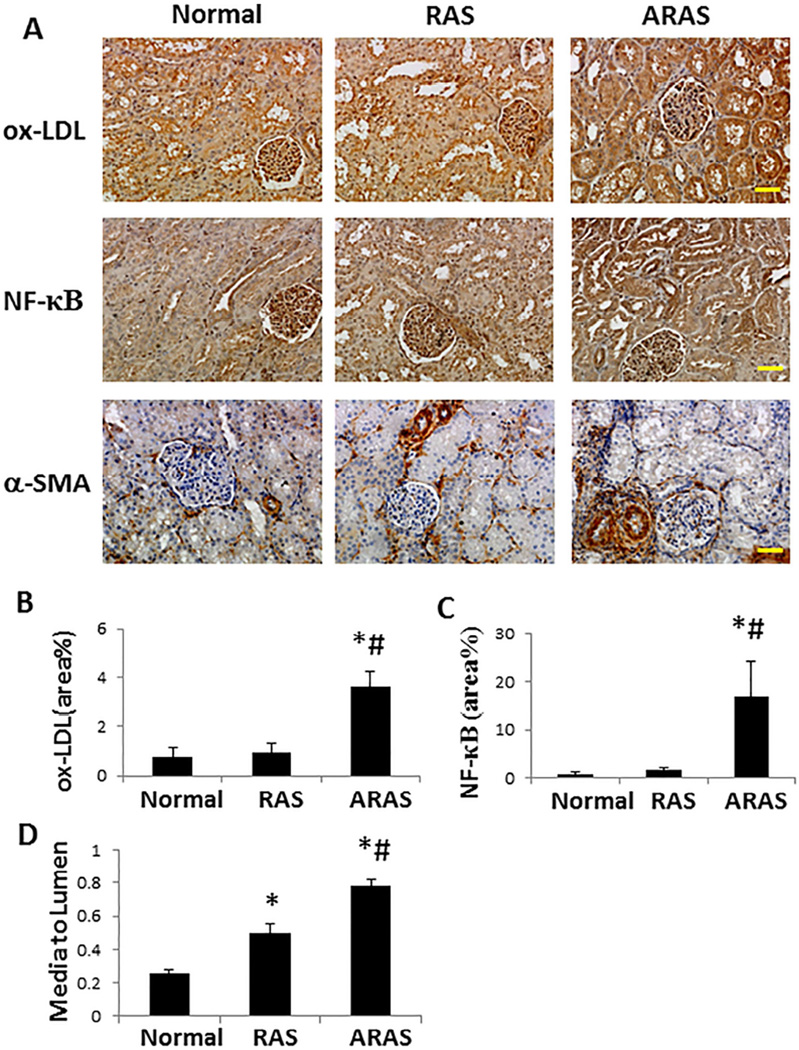
Figure 3.
Immunohistochemical staining. A. Representative ox-LDL, NF-κB and α-SMA staining (all ×20). B, C. ox-LDL and NF-κB immunoreactivity increased in ARAS compared with both Normal and RAS. D. Renal microvascular media-to-lumen ratio (α-SMA) increased in RAS compared with Normal, and further in ARAS compared with Normal and RAS. *P<0.05 vs. Normal; #P<0.05 vs. RAS. Scale bar=50 µm.

