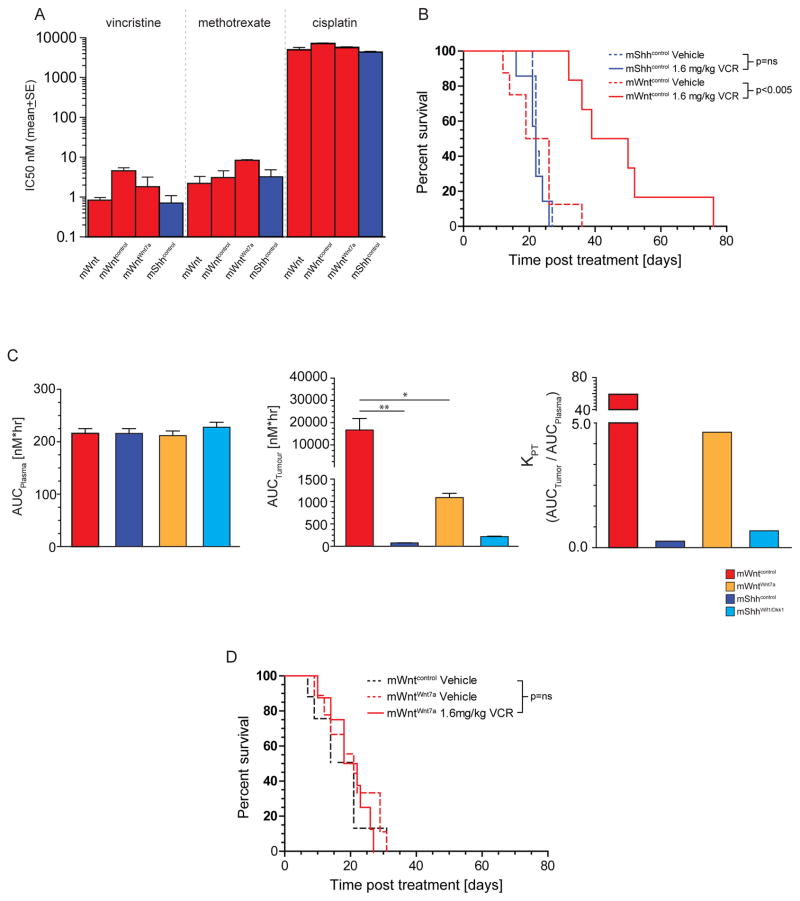
Figure 8. BBB function dictates medulloblastoma exposure and response to vincristine in vivo.
A. Growth inhibition assays of mouse medulloblastoma cells following 72 hour exposure to the indicated drugs. B. Kaplan-Meyer survival curves of mShhcontrol and mWntcontrol-medulloblastomas to vincristine therapy. C. Vincristine area under the curve (AUC) plots for plasma (left), tumour tissue fluid (middle) and KPT (right) in mice harbouring the indicated medulloblastomas. D. Kaplan-Meyer survival curves of mWntcontrol- or mWntWnt7a- medulloblastomas treated with vincristine therapy. *=P<0.05, **=P<0.005, Mann-Whitney.

