Fig. 5. Histological analysis of explants in group A.
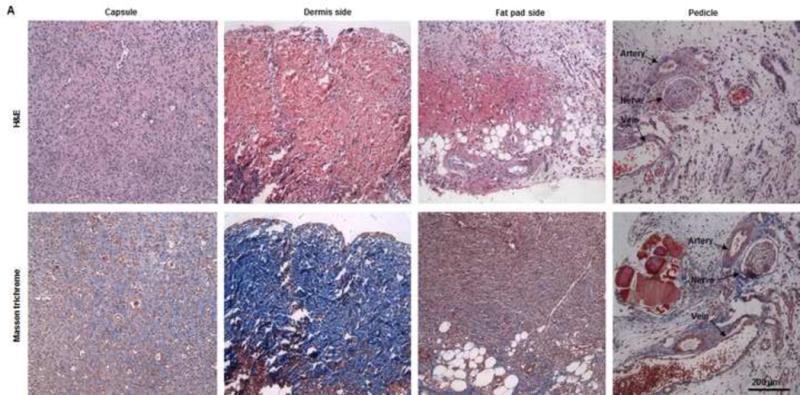
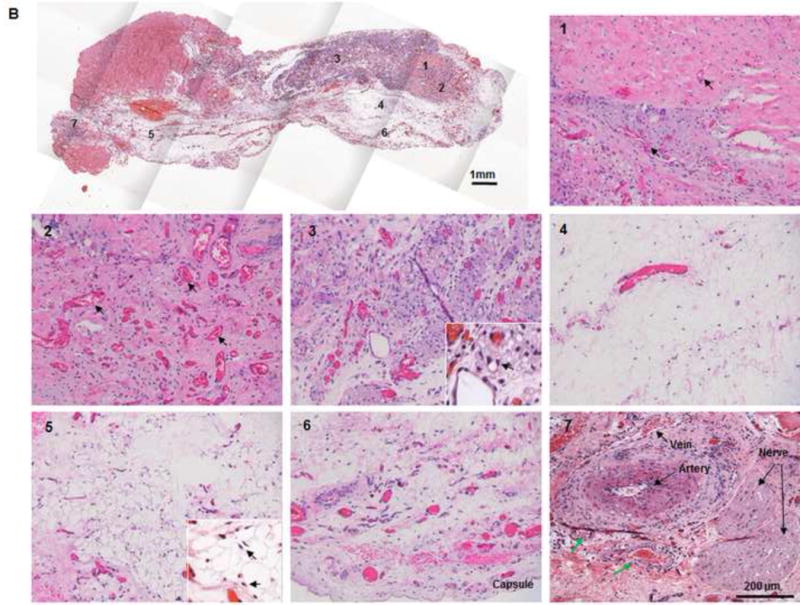
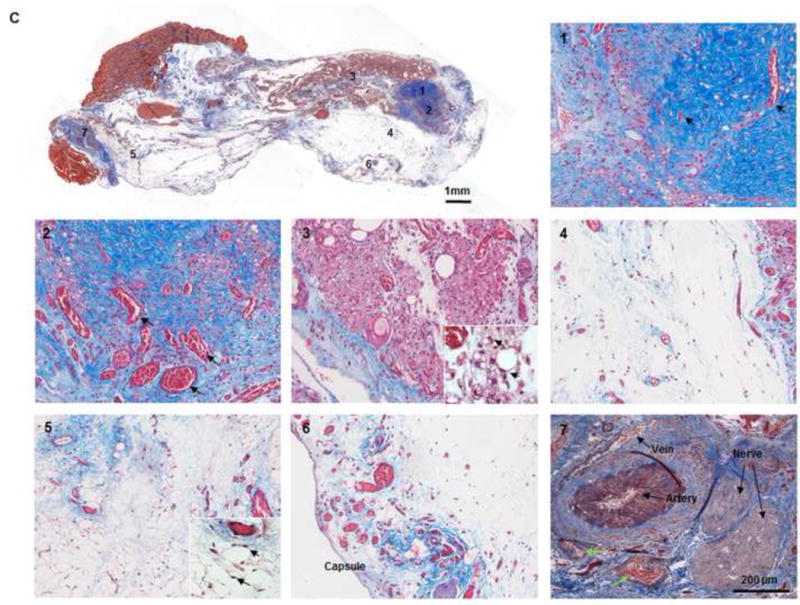
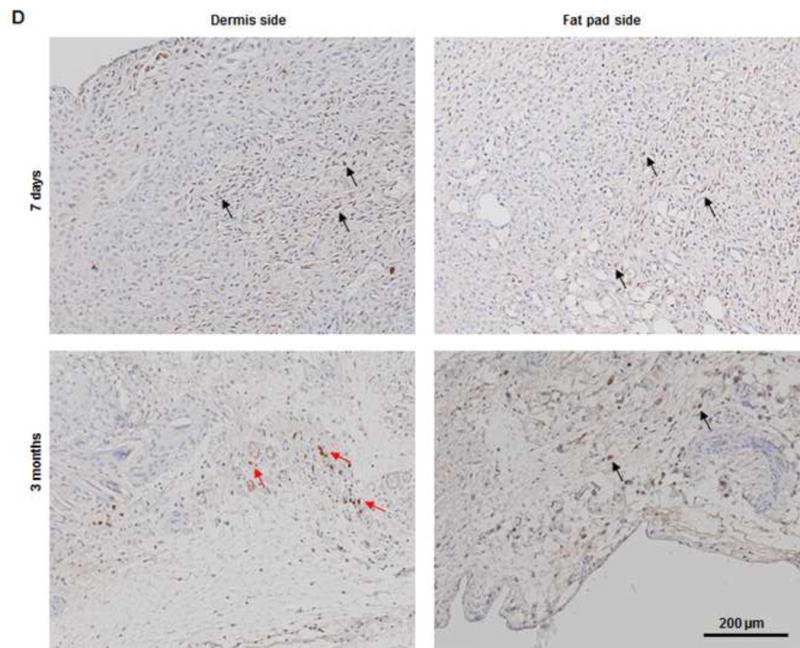
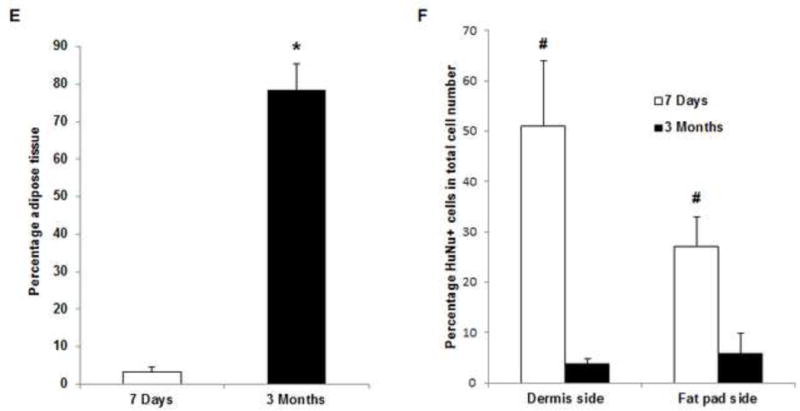
(A) H&E and Masson trichrome staining revealed an inflammation reaction characterized by cellular and vascular infiltration in the tissue at day 7. Lots of intravascular red blood cells were within the large-diameter blood vessels in the pedicle area. (B, C) H&E and Masson trichrome staining showed constructive remodeling in the implant at 3 months. Most dermis tissue was degraded and remodeled as adipose fascial tissue, and a small portion of dense collagen remained. The fat pad side of the implanted flap construct was fully remodeled, showing mature adipose tissue formed by adipocyte cells. (The numbered areas in the top images are magnified in the correspondingly numbered bottom images). The center of the dermis (images 1&2) was undergoing constructive remodeling, with dense collagen, highly vascular infiltration (black arrows), and numerous adipocytes. The outer layer of the dermis (image 3) showed a high level of remodeling, with numerous proliferating adipocytes (black arrows), blood vessel formation, and collagen that was less dense than that in the center of the dermis. The fat pad side of the construct (images 4–6) was completely remodeled, showing mature adipose tissue (black arrows), loose fascial tissue, a high number of blood vessels, and no inflammatory cells. In the pedicle area of the construct (image 7), myointimal hyperplasia of the main artery was present, the vein was patent, a number of functional vessels grew (green arrows), and the intact sensory nerve structure was recellularized. (D) The presence of donor cells was evaluated by immunohistochemical staining for an anti-HuNu antibody. HuNu-positive cells were distinguishable and persistent at 7 days and 3 months. Donor cells were closely located around the vascular structures (red arrow) and adipose structures (black arrow) at 3 months. (E) The area of adipose tissue at 3 months was significantly greater than that at 7 days. *: P<0.05 as compared to 7 days. (F) There were significantly fewer HuNu-positive cells at 3 months than at 7 days. The percentage of donor cells at 3 months was significantly lower than that at 7 days. #: P<0.05 as compared to 3 months.
