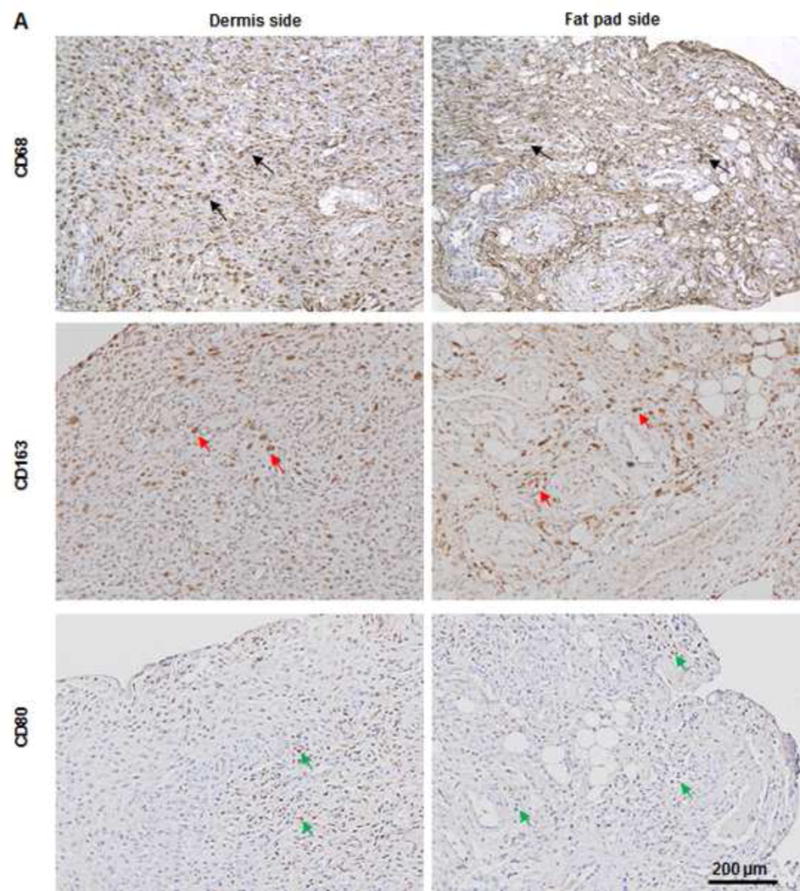
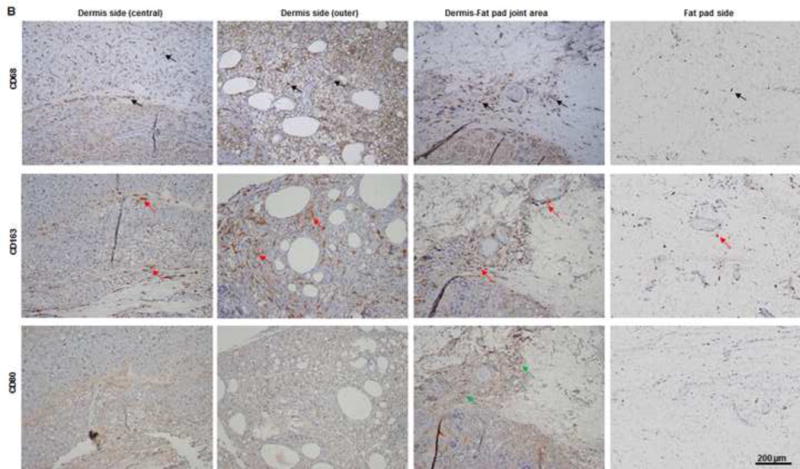
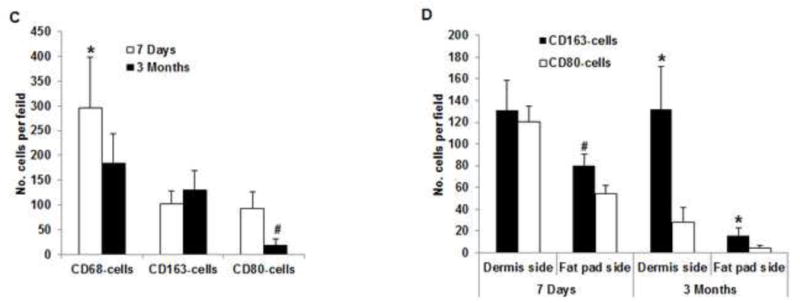
Fig. 7. IHC analysis of explants in group A.


(A) As predominant inflammatory cells, many CD68-positive macrophages (black arrows) infiltrated the construct at day 7. Among these cells, both CD80-positive macrophages (M1 macrophages; green arrows) and CD163-positive macrophages (M2 macrophages; red arrows) were found throughout the sample tissue. (B) There were significantly fewer CD68-positive macrophages (black arrows) and CD80-positive macrophages (green arrows) at 3 months than at 7 days. Most macrophages were CD163-positive M2 macrophages (red arrows), which predominantly infiltrated the dermis side. Much fewer inflammatory macrophages were present in the fat pad side, indicating that the area was fully remodeled. (C) There were significantly fewer CD68- and CD80-positive macrophages at 3 the fat pad side at 7 days and in both the dermis and fat pad side at 3 months. *: P<0.05 as compared to CD80; #: P<0.05 as compared to CD80.
