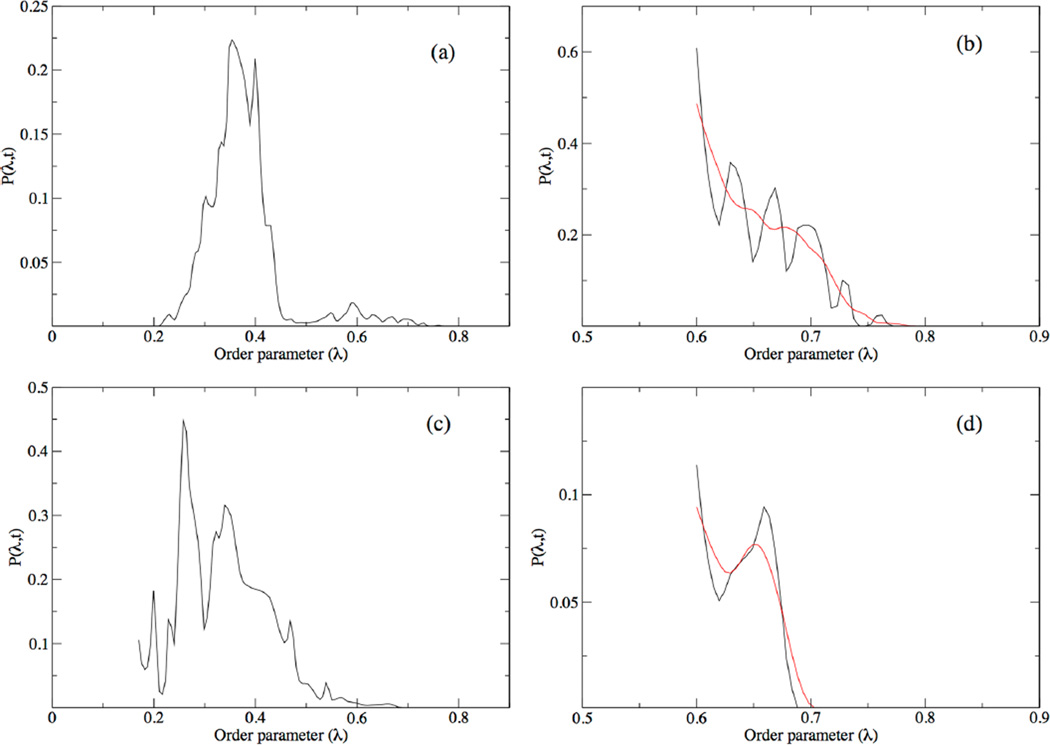
Figure 2.
Normalized histograms depicting the Hermite interpolation of full distribution function, P(λ,t), for the calculation of C(t′) for the hydride (a) and deuteride (c) systems. The last window, P(λ,t;i), of each distribution ((b) for the hydride system and (d) for the deuteride system) was denoted as the product region, and they were smoothed with a Gaussian function (shown in red) which was then integrated to determine C(t′).

