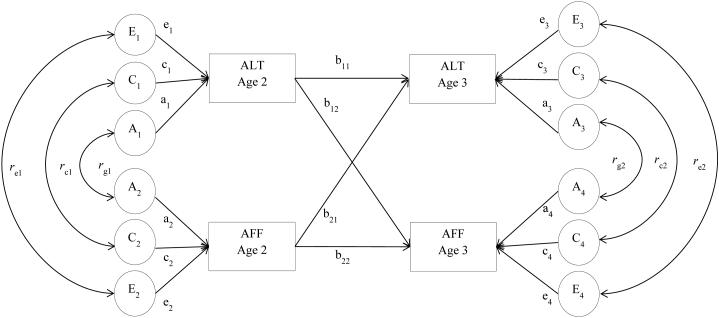
Fig 1. A path diagram of the cross-lagged model shown for one twin.
Latent factors appear in circles (i.e., A for genetic factors, C for shared environments, E for nonshared environments), while observed (measured) variables appear in rectangles. Latent factors at age 3 represent residual variances. Standardized path estimates for the latent factors are indicated by lowercase letters (e.g., a1, c1, e1). Cross-age stability is represented by b11 and b22, while b12 and b21 indicate cross-lagged effects. Double-headed arrows linking two latent factors represent genetic, shared environmental, or nonshared environmental correlations (i.e., rg1, rc1, re1, rg2, rc2, re2).

