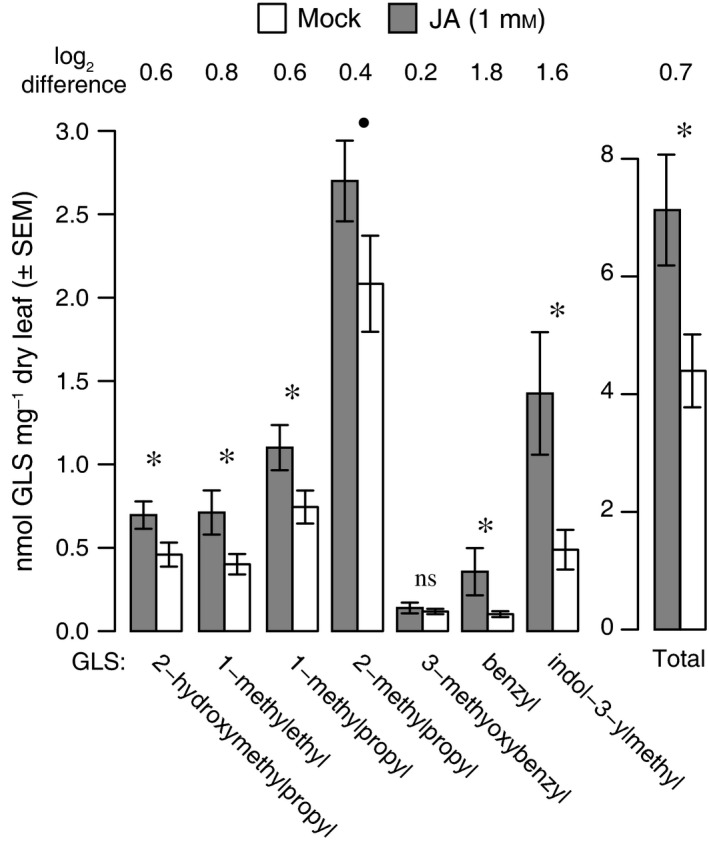
Figure 2.

Foliar glucosinolate (GLS) induction in bittercress leaves following whole plant treatment with 1 mmol/L JA. Bars indicate absolute induction (nmol/mg leaf dry mass), while log2 differences indicate relative induction between JA and mock for each detected GLS. *P < 0.05, •0.1 > P ≥ 0.05, ns = nonsignificant (see Materials and Methods for statistical procedures).
