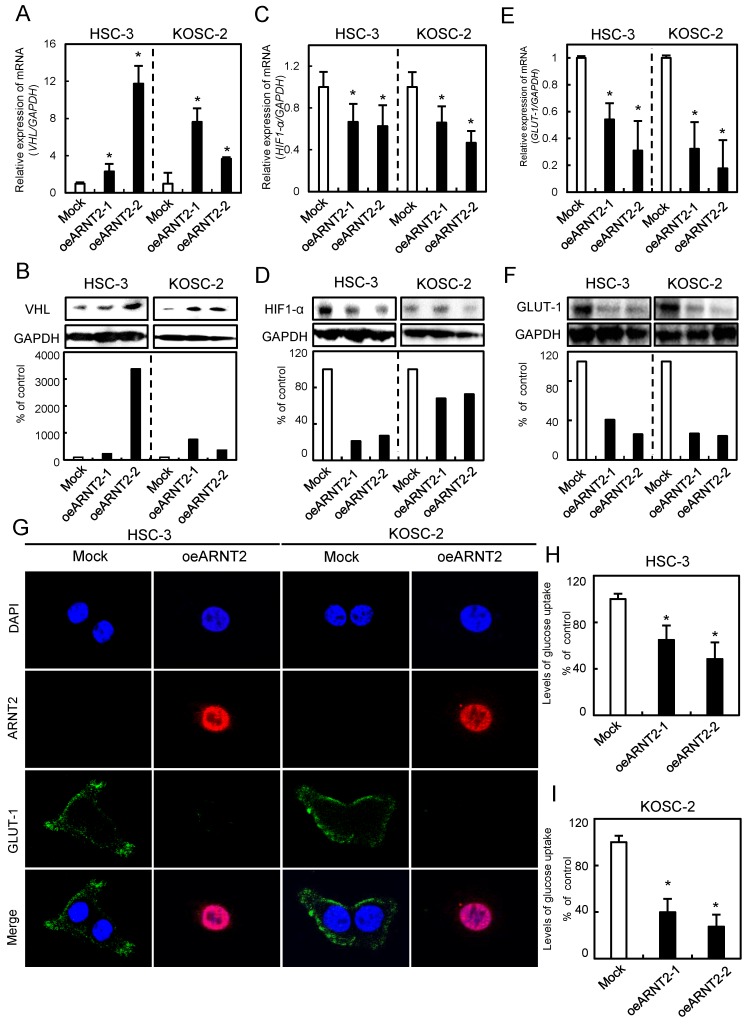
Figure 5.
Evaluation of VHL, HIF1-α, and GLUT-1 expression levels in ARNT2 overexpressed cells. (A) Expression of VHL mRNA in oeARNT2 and Mock cells. The VHL mRNA expression level in the oeARNT2 cells is significantly (*P < 0.05, Mann-Whitney U test) higher than in the Mock cells. (B) Immunoblot analysis shows that the VHL protein levels in the oeARNT2 cells are increased markedly compared with the Mock cells. (C) Expression of HIF1-α mRNA in the oeARNT2 and Mock cells. The HIF1-α mRNA expression level in the oeARNT2 cells is significantly (*P < 0.05, Mann-Whitney U test) lower than in the Mock cells. (D) Immunoblot analysis shows that the HIF1-α protein levels in the oeARNT2 cells are decreased markedly compared with the Mock cells. (E) The expression levels of GLUT-1 mRNA in the oeARNT2 and Mock cells. The GLUT-1 mRNA expression level in the oeARNT2 cells is significantly (*P < 0.05, Mann-Whitney U test) lower than in the Mock cells. (F) Immunoblot analysis shows that the GLUT-1 protein levels in the oeARNT2 cells are also decreased markedly compared with the Mock cells. (B, D, F) Densitometric protein data are normalized to the GAPDH protein levels. The values are expressed as a percentage of the Mock cells. (G) Strong immunoreactivity of ARNT2 and weak immunoreactivity of GLUT-1 are seen in the oeARNT2 cells, whereas strong immunoreactivity of GLUT-1 and weak immunoreactivity of ARNT2 are seen in the Mock cells (red, ARNT2; green, GLUT-1; blue, DNA). ARNT2 is localized in the nucleus and cytosol of the oeARNT2 cells. GLUT-1 is localized in the cell membrane. (H, I) A glucose uptake assay shows that ARNT2 overexpression results in significantly (P < 0.05) decreased levels of glucose uptake compared with the Mock cells. The values are expressed as a percentage of the Mock cells.

