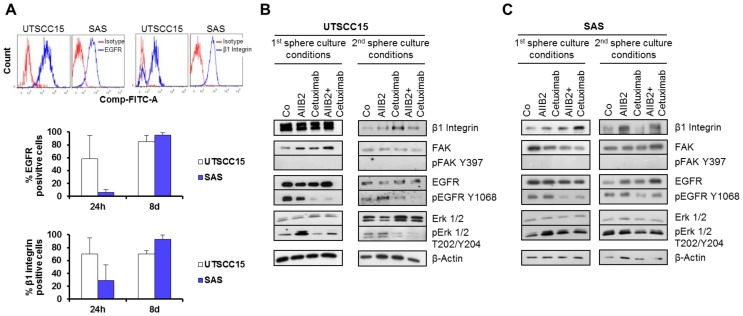
Figure 2.
β1 integrin and EGFR expression are similar in primary and secondary spheres. (A) EGFR and β1 integrin surface expression in UTSCC15 and SAS primary spheres analyzed by flow cytometry. (B) Western blot analysis of indicated proteins on whole cell lysates from UTSCC15 and SAS primary and (C) secondary spheres. β-Actin served as loading control. Results show mean ± SD (n = 3).

