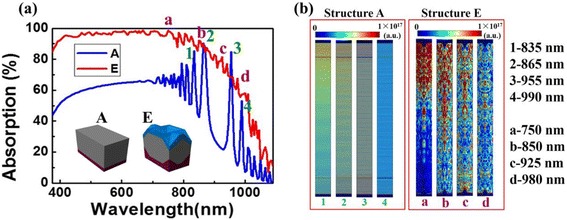
Fig. 5.

a Comparison of the absorption spectra of structures A and E. b Optical absorption profiles inside the structure A (left) and the structure E (right), respectively. The wavelength selected for structure A is of 1—835 nm, 2—865 nm, 3—955 nm, and 4—990 nm, while for structure E is of a—750 nm, b—850, c—925 nm, and d—980 nm
