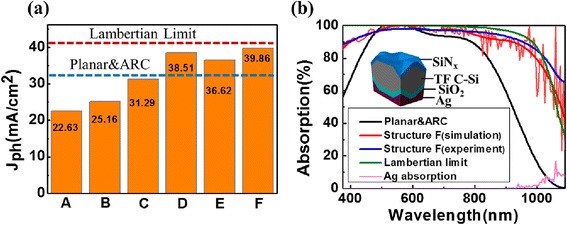
Fig. 6.

a Comparison of the photocurrent density theoretically generated for the six structures denoted in Fig. 4 (A—planar; B—rear INP; C—front INP; D—front INP and SiNx; E—double-sided INP and SiNx; F—double-sided INP and SiNx andSiO2), the Lambertian limit (red line) and the planar and ARC structure (blue line) are also shown. b Comparison of the simulated and experimental absorptance spectra of structure F, the absorptance spectra of planar and ARC structure and the Lambertian limit for 20-μm-thick c-Si are also shown
