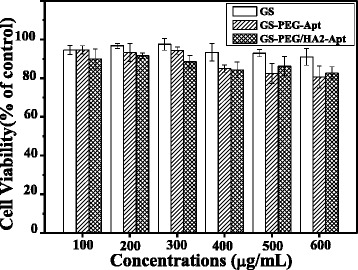
Fig. 5.

Normalized dose-response for cell viability of GS, GS-PEG-Apt, and GS-PEG/HA2-Apt NPs by MTT assay. Bars represent the corresponding standard deviations (n = 6)

Normalized dose-response for cell viability of GS, GS-PEG-Apt, and GS-PEG/HA2-Apt NPs by MTT assay. Bars represent the corresponding standard deviations (n = 6)