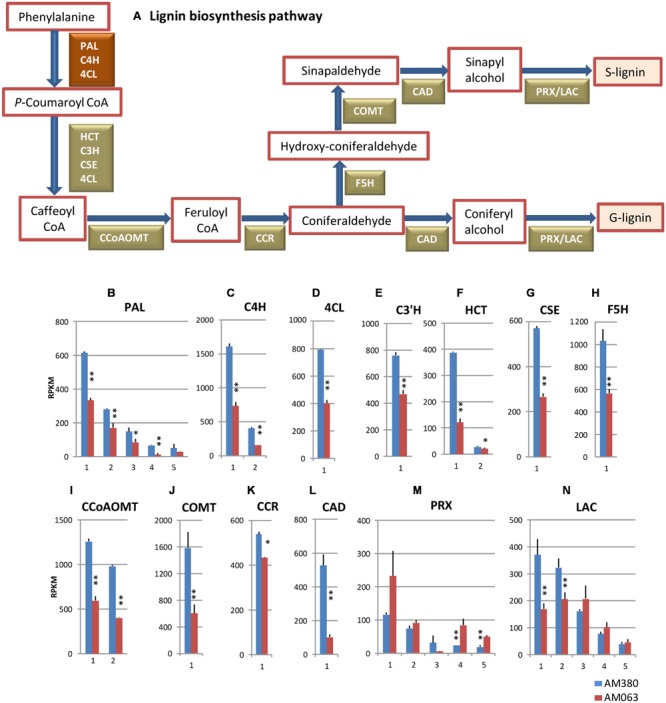
FIGURE 4.

Lignin biosynthesis pathway (A) and comparison of the transcript profiles of genes related to lignin biosynthesis, PAL (B), C4H (C), 4CL (D), C3′H (E), HCT (F), CSE (G), F5H (H), CCoAOMT (I), COMT (J), CCR (K), CAD (L), PRX (M) and LAC (N). Numbers on the X-axis represent gene numbers listed in Supplementary Table S2. RPKM values are plotted on the Y-axis. Data collected from three independent repeats were analyzed. Mean values and standard deviations are shown with error bars. Asterisks or double asterisks indicate significant differences at p < 0.05 or p < 0.01, respectively.
