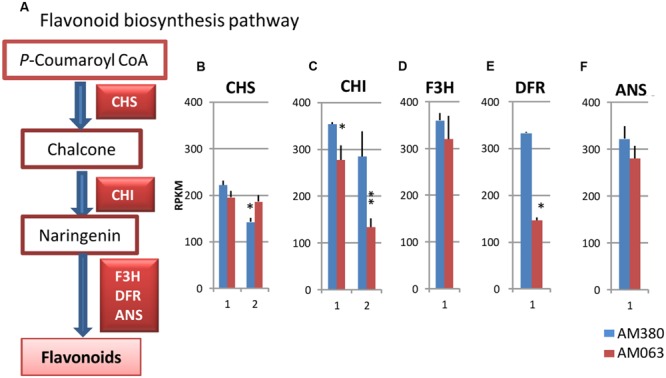
FIGURE 5.

Flavonoid biosynthesis pathway (A) and transcript profiles of genes related to flavonoid biosynthesis, CHS (B), CHI (C), F3H (D), DFR (E) and ANS (F). Numbers on the X-axis represent gene numbers listed in Supplementary Table S2. RPKM values are plotted on the Y-axis. Data collected from three independent repeats were analyzed. Mean values and standard deviations are shown with error bars. Asterisks or double asterisks indicate significant differences at p < 0.05 or p < 0.01, respectively.
