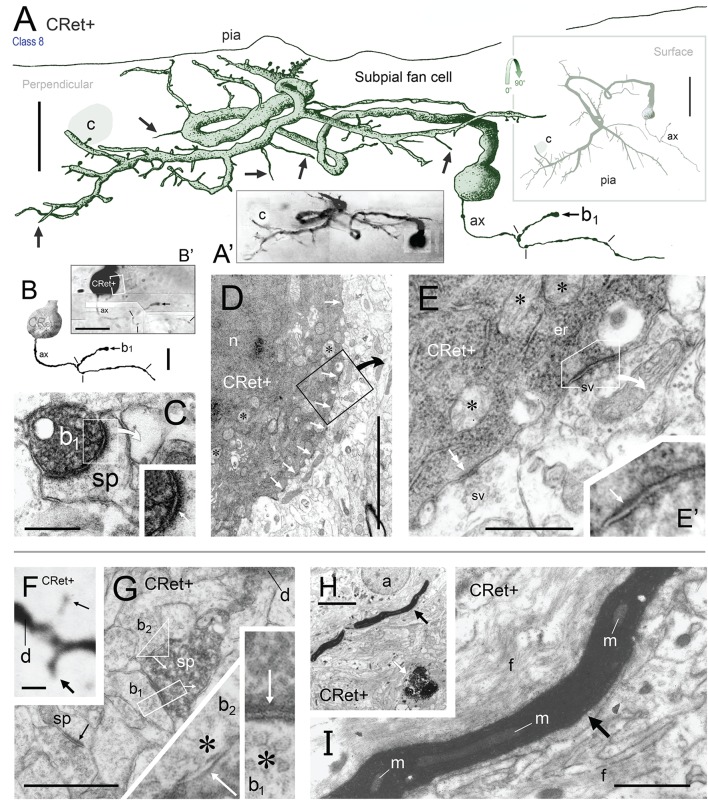
Figure 9.
(A) Oblique view of a reconstructed class 8 SPF cell in area 46v. Note the unipolar soma and the numerous thorns (arrows) arising from the dendrites. The labeled initial axonal segment (ax) and several varicosities (lines) are indicated. One terminal swelling (b1) is highlighted (arrow). The profile of a capillary (c) is shown. Scale bar: 25 μm. (A′) Photographic montage of the SPF cell in (A). (B) Drawing highlighting the axon initial segment of the CRet+ cell in (A). Scale bar: 10 μm. (B′) Photomicrographic montage of initial portion of axon. Axon bouton b1. (C) Correlated ultrastructural analysis revealed CRet+ bouton b1 formed a synaptic junction with the cupped profile of a dendritic spine head (sp). Scale bar: 1.0 μm. Inset: High magnification image showing the asymmetric (A-type) nature (arrow) of the junction seen in (C). (D) Electron micrograph of part of the CRet+ SPF soma seen in (A,B). The soma receives a very high number of closely positioned synaptic contacts from unlabeled boutons (CRet-) (white arrows). Abundant mitochondia (asterisks), endoplasmic and hordes of ribosomes are present in the cell cytoplasm (asterisks). Nucleus, n. The boxed region is shown at higher magnification in (E). Scale bar: 5.0 μm. (E) An unlabeled A-type synapse innervates the SPF soma (see E′). Elsewhere a CRet- bouton forms a S-type axosomatic junction (double headed arrow). Mitochondria (m) and rough endoplasmic reticulum (er) are indicated. Synaptic vesicles (sv). Scale bar: 1.0 μm. (E′) High magnification of the A-type axosomatic junction in (E) (arrow). (F) CRet+ dendrite (d) issuing a large headed dendritic spine (arrow) and a fine spine (thin arrow — away from focal plane). Scale bar: 2.0 μm. (G) Correlated ultrastructure of the large spine (sp) in (F) receiving A-type input from bouton b1 and S-type input from bouton b2. Both pre-synaptic boutons are unlabeled. Synaptic vesicles (asterisk). Scale bar: 2.0 μm. (H) CRet+ filamentous process (arrow) from a SPF cell. Electron-dense profile of cellular debris (white arrow). Astrocyte, a. Scale bar: 5.0 μm. (I) Enlargement of the filament in (H). Note mitochondrial profiles. Numerous unlabeled fine filamentous strands (f). Scale bar: 5.0 μm.

