
Figure 7.
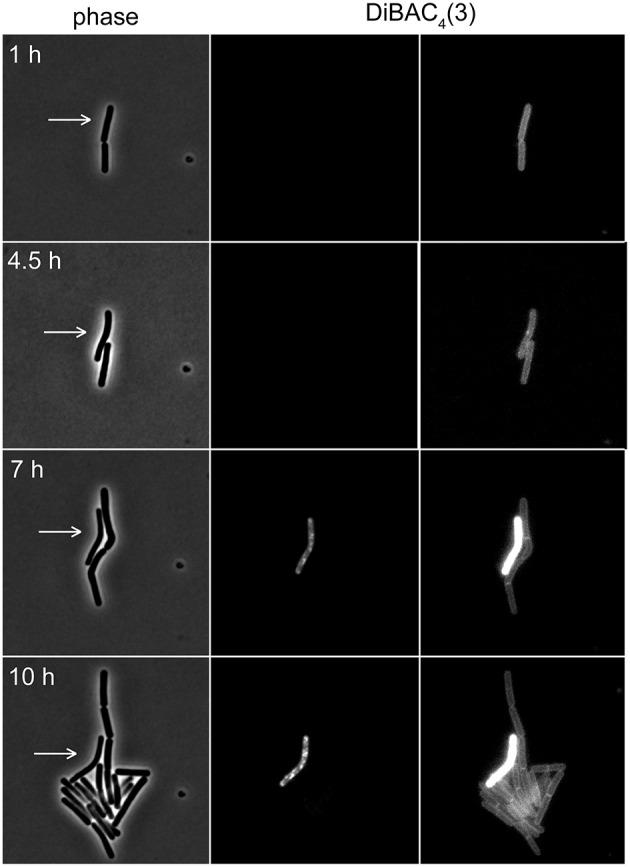
Time-lapse microscopy using voltage sensitive dye DiBAC4(3). Selected images of a time-lapse microscopy experiment carried out with B. subtilis cells stained with DiBAC4(3). Phase contrast images (left panel) and DiBAC4(3) fluorescence images (right panels) are depicted. Due to the strong fluorescence intensity difference between polarized and depolarized cells, the images are shown with two different contrast settings. High fluorescence intensity of DiBAC4(3) indicates low membrane potential. An individual cell that failed to enter logarithmic growth and subsequently undergoes membrane depolarization, is indicated with an arrow. See Supplementary Movie 1 for an example of a whole time-lapse series. Strain used: B. subtilis 168 (wild type).