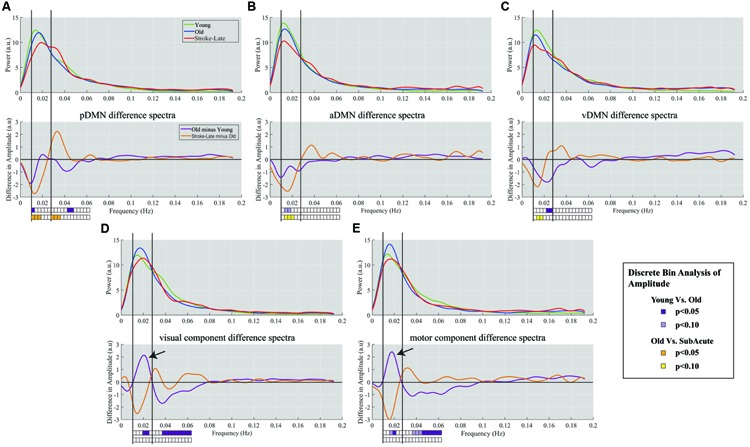
FIGURE 4.

Spectra difference plot for: Top row: each of the three components of the DMN: (A) pDMN, (B) aDMN, (C) vDMN, Bottom row: two non-DMN components of (D) primary visual, and (E) primary sensorimotor. For each panel, top graph is a representation of the smoothed mean spectra with young (green), old (blue), and stroke-late (red). The bottom panels represent the difference between the mean spectra, with purple plot characterizing the difference between YHA and OHA, and the orange plot indicating the difference between stroke-late and OHA. Solid vertical lines demark limits of the slow-5 oscillation range (0.01–0.027 Hz) and dotted vertical lines mark the upper limit of the slow-4 frequency range (0.027–0.073 Hz). The boxes below the plots indicate the statistical significance for the discrete bin analysis of amplitude. Within the DMN, differences in stroke-late vs. OHA were noted to have large negative deflection in the slow-5 range, indicating a further reduction of the slow-5 oscillations on top of the observed reduction from aging (OHA – YHA). In the two assessed ‘task-positive’ networks, stroke-late groups exhibited a similar decrease in the oscillations. However, the aging process demonstrated a different pattern with a surge of slow-5 oscillations amplitude in those components (black arrows), coupled with a reduction of slow-4 oscillations.
