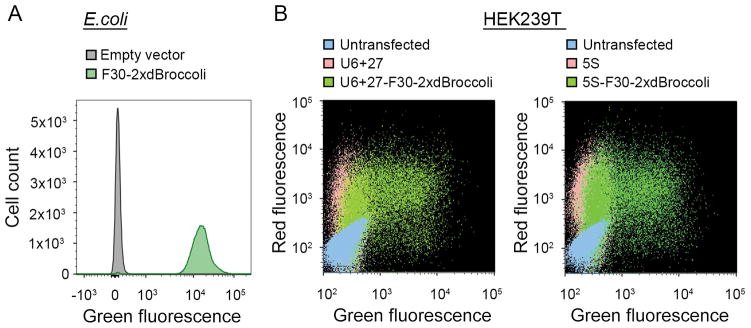
Figure 3.
Flow cytometry analysis reveals bright fluorescent cell population. (A) Flow cytometry analysis of the pET28c- or pET28c-F30-2xdBroccoli-transformed bacteria. The RNA was expressed for 4 h and then the cells were treated with 40 μM DFHBI-1T and analyzed using a FACSAria II instrument as described in the Basic Protocol 2. Fluorescent events were detected in the modified FITC channel (488 nm excitation and 530±25 emission filter). The data is presented as an overlay of the histograms for the pET28c- and pET28c-F30-2xdBroccoli-transformed bacteria. Broccoli-expressing cells are more than 100 fold brighter than the negative cell population. (B) Flow cytometry analysis of the untransfected mammalian cells or the cells transfected with pAV5S or pAVU6+27 (negative controls) or with pAV5S-F30-2xdBroccoli or pAVU6+27-F30-2xdBroccoli. mCherry-expressing plasmid was co-transfected as a transfection efficiency control. The cells were harvested 72 h after transfection and treated with 40 μM DFHBI-1T as described in the Alternate Protocol 2. The data is presented as a two-parameter dot plot with both FITC (488 nm excitation and 530±25 emission filter) and PE-Texas Red (561 nm excitation and 610±10 nm emission) channels presented. Broccoli-expressing cells show high transfection efficiency and robust fluorescent signal in both channels, compared to the controls.

