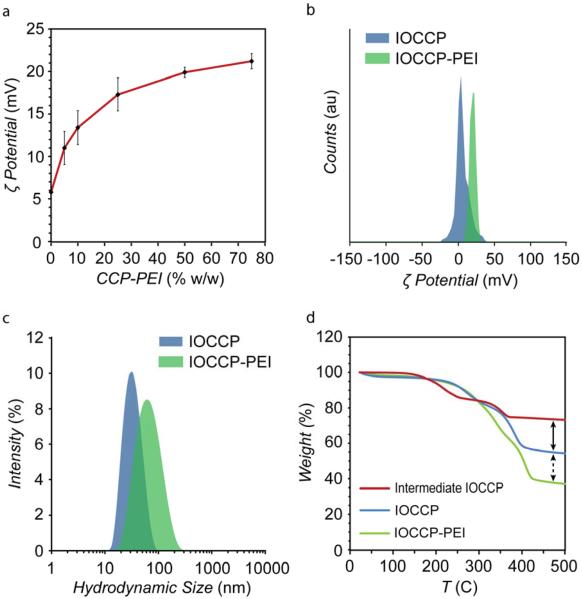
Figure 3.
Characterization of size and surface properties of IOCCP and IOCCP-PEI. a) Evaluation of change in weight % CCP-PEI on ζ potential of IOCCP-PEI. The mean ζ potential for each ratio was determined from three separate batches of IOCCP-PEI. Error bars = standard deviation. b) ζ potential distributions of IOCCP (blue) and IOCCP-PEI (green) in 20mM HEPES, pH 7.4. c) Intensity based hydrodynamic size distributions of IOCCP (blue) and IOCCP-PEI (green) in 20mM HEPES, pH 7.4. d) TGA analysis showing increased polymer density for IOCCP and IOCCP-PEI (50% CCP-PEI w/w) as compared to intermediate IOCCPs.

