Figure 1.
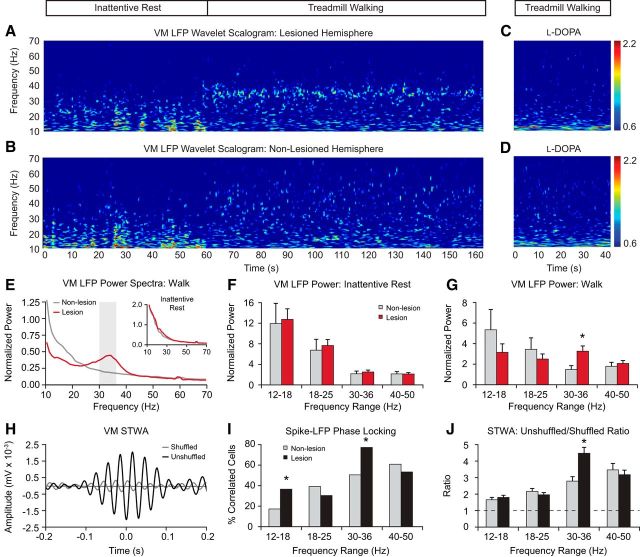
LFP power in paired recordings from the VM in nonlesioned and dopamine cell-lesioned hemispheres during periods of rest and treadmill walking. Recordings are from days 21–28 after lesion (n = 10 rats). A, B, Representative time–frequency wavelet scalograms of LFP spectral power in recordings from VM during rest and walking (horizontal bar above). Power is plotted on a logarithmic scale with greater values represented by red. Note the emergence of the high beta oscillatory band in the VM scalogram from the lesioned hemisphere during walking. C, D, Reduction of the high beta/low gamma Hz LFP oscillations in the VM spectral power scalogram in the lesioned hemisphere after treatment with l-DOPA in recordings from the same animal as in A and B. E, Averaged power spectra of VM LFP from the lesioned (red) and nonlesioned (gray) hemispheres during treadmill walking and rest (inset). F, G, Averaged total LFP power (mean ± SEM) within discrete frequency ranges shows significantly increased values in the 30–36 Hz range in the lesioned hemisphere during walking (G) relative to rest (F) and the nonlesioned hemisphere (p < 0.05). H, Example of VM spike–LFP synchronization in the 30–36 Hz range from the lesioned hemisphere during walking. Graph shows the STWAs from the original spike train (black) and the shuffled spike train (gray). I, J, Proportion of VM STWAs showing significant phase locking of spike trains with LFP activity (I) and mean STWA-based amplitude ratios (J) are significantly higher in the 30–36 Hz range in the lesioned hemisphere (black bars) relative to the nonlesioned hemisphere (gray bars) (p < 0.001). Dashed line in J indicates ratio 1. *Significant difference between lesioned and nonlesioned hemispheres.

