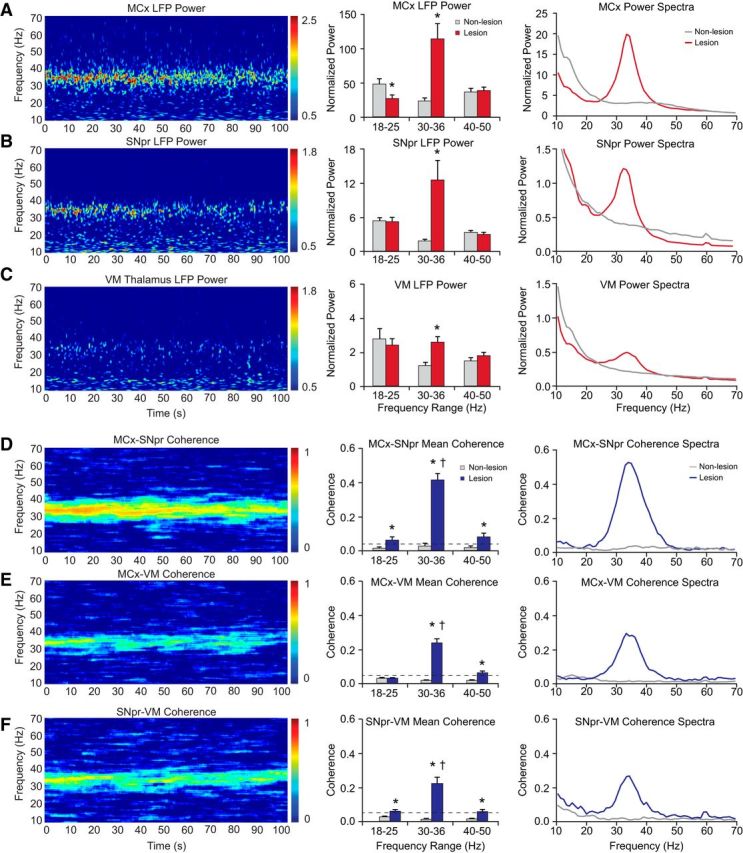
Figure 2.

LFP oscillatory activity in the MCx, SNpr, and VM thalamus in dopamine cell-lesioned and nonlesioned hemispheres during treadmill walking. A–C, LFP power. Left, Representative time–frequency wavelet-based scalograms of LFP spectral power in the lesioned hemisphere plotted on a logarithmic scale. Middle, Averaged normalized LFP total power (mean ± SEM) over a range of frequencies during treadmill walking. Right, Averaged and normalized LFP power spectra. D–F, Coherence of LFP activity within BG–thalamocortical circuit. Left, FFT-based time–frequency coherence between MCx and SNpr (D), MCx and VM (E), and SNpr and VM (F) in the lesioned hemisphere. Coherence spectrograms are plotted on a linear scale with greater values represented by red. Middle, Averaged coherence (mean ± SEM) in low beta (18–25 Hz), high beta (30–36 Hz), and gamma (40–50 Hz) frequency ranges. Right, Averaged coherence spectra. Note the emergence of synchronized oscillations in the high beta-frequency range in recording from all three regions in the dopamine cell-lesioned hemisphere. Evident in bars and spectra (A–F, middle and right) are significant increases in the MCx, SNpr, and VM power (p < 0.05) and coherence (p < 0.01) between these nodes of the BG–thalamocortical circuit within the 30–36 Hz frequency range in the lesioned hemispheres. *Significant difference between lesioned and nonlesioned hemispheres. †Significant difference in coherence between frequency ranges.
