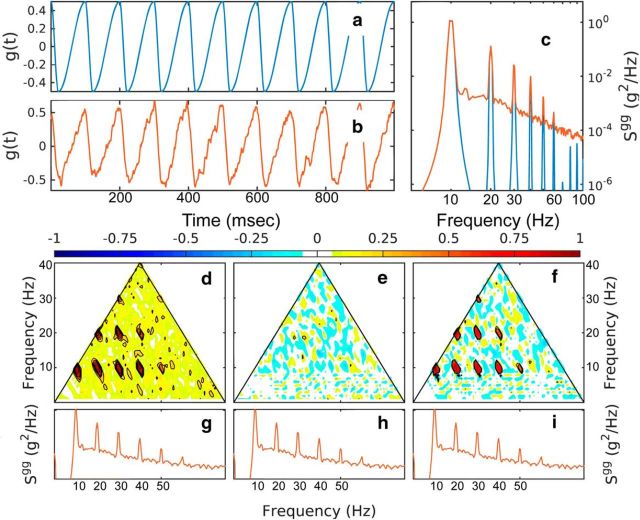
Figure 3.
Bispectral analysis of a noisy time series with positive asymmetry. a, Signal based on a sinusoidal function. b, Signal with added f−2 Gaussian noise with at 20% signal variance. c, Spectra of the two time series. d–f, Normalized bispectrum of the noisy time series depicting the modulus (d), the real part (e; skewness distribution, and the imaginary part (f; asymmetry distribution). The power spectra of the signal with added f−2 Gaussian noise are repeated in g–i for reference.

