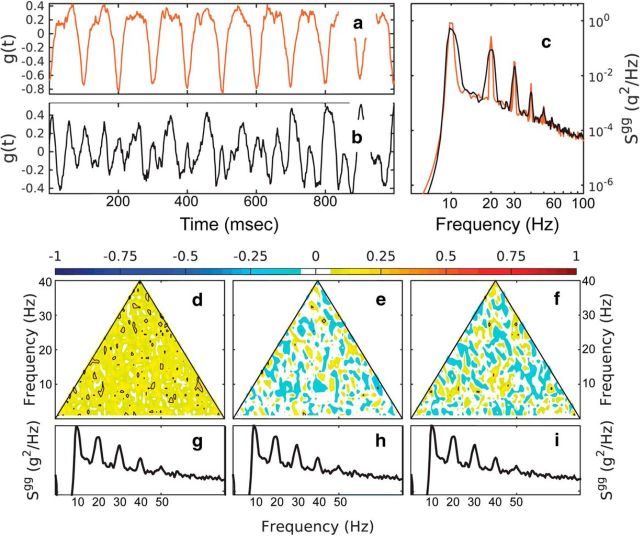
Figure 4.
Bispectral analysis of a linear and nonlinear time series. a, b, Nonlinear signal (a; red) and linear signal (b; black) constructed from the spectrum of the nonlinear signal using random phases uniformly distributed in [0, 2π]. c, Spectra of the nonlinear and linear time series (red and black, respectively). d–f, Normalized bispectrum of the linear time series (cf. Figs. 2, 3) for the modulus (d), the real part (e; skewness distribution), and imaginary part (f; asymmetry distribution). The power spectra of the linear decomposition are repeated in g–i for reference.

