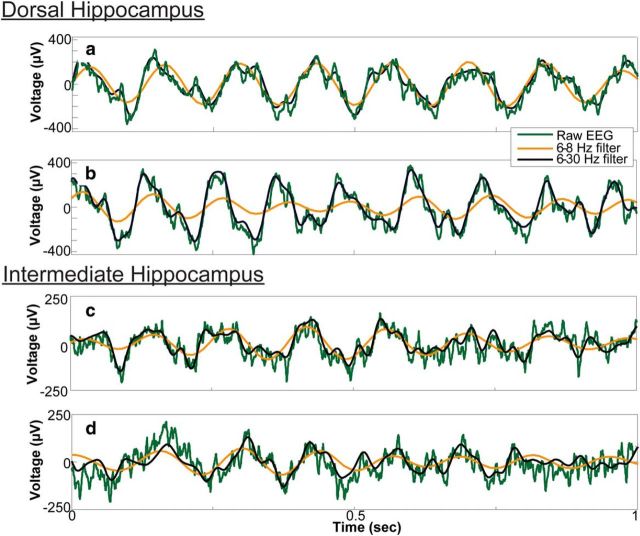
Figure 5.
Change of LFP shape as a function of rat running speed. Representative examples of LFP during low running speeds (<20 cm/s; a, c) and high running speeds (>20 cm/s; b, d) showing the raw data (green), narrow filter (orange), and wide-band filter (black) that captures the asymmetry that developed as a function of running velocity in the dorsal hippocampus.

