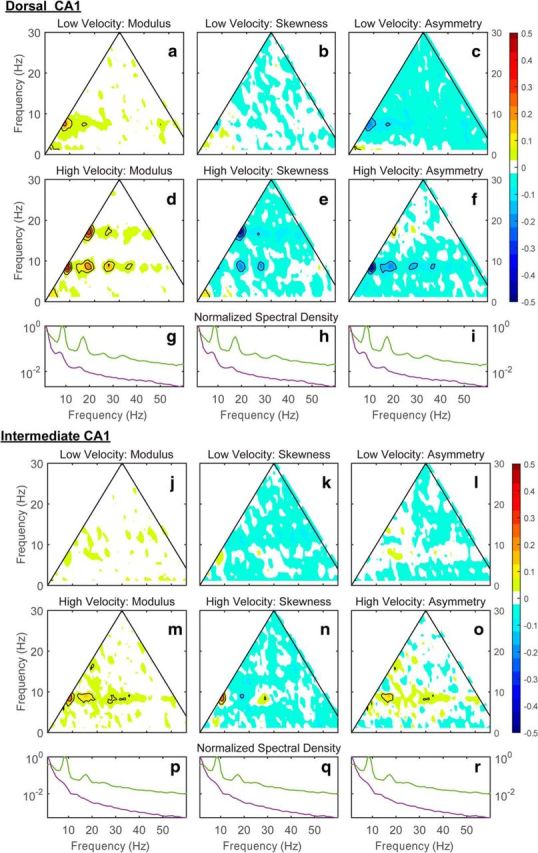
Figure 7.

Representative bispectral properties of hippocampal LFP in the dorsal and intermediate CA1 region from rat 7805. The variability of the normalized bispectral distribution as a function of running speed (a–c: speed <10 cm/s; d–f: speed >30 cm/s) for the modulus (a, d), the real part (b, e; skewness distribution), and the imaginary part (c, f; asymmetry distribution). g, h, Normalized power spectral densities (maximum value = 1) are provided for reference (red, low speed; blue, high speed). Note that, in d, the contour lines outline 6 distinct regions of triad phase correlations (using the format fn, fm, fn+m depicted in Fig. 1: [8 Hz, 8 Hz, 16 Hz], [16 Hz, 8 Hz, 24 Hz], [24 Hz, 8 Hz, 32 Hz], and [32 Hz, 8 Hz, 40 Hz], [16 Hz, 16 Hz, 32 Hz], [24 Hz 16 Hz 48 Hz]). j–r are equivalent to a–i except that data were obtained from intermediate CA1. Bispectral maps are colored for absolute values >90% (>0.05) and contoured for absolute values >95% (>0.1). Contour lines are drawn with an increment of 0.05.
