Figure 2.
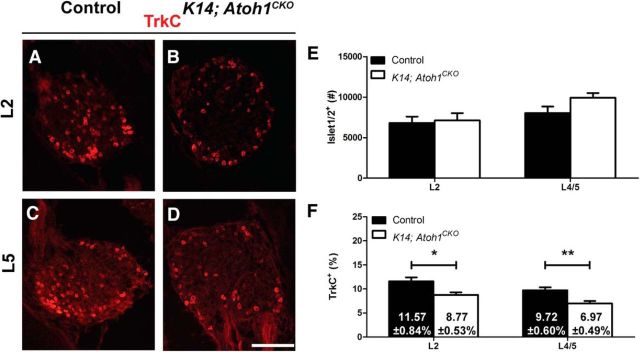
Loss of TrkC expression but not neurons in DRGs of P0 K14; Atoh1CKO mice is consistent across spinal levels. A–D, Immunostaining for TrkC in L2 and L4/5 DRG sections from P0 control littermate and K14; Atoh1CKO mice. E, Numbers of Islet1/2+ neurons in P0 L2 and L4/5 DRGs from control and K14; Atoh1CKO mice (n ≥ 7 mice/genotype at each level). F, Percentages (numbers ± SEM shown in bars on graph) of Islet1/2+ L2 (n = 7 mice/genotype) and L4/5 (n = 15–18 mice/genotype) DRG neurons that were TrkC+ in P0 control and K14; Atoh1CKO mice. In graphs, error bars represent the SEM, and asterisks indicate statistically significant differences between genotypes. *p < 0.05; **p < 0.01. Scale bar, 100 μm.

