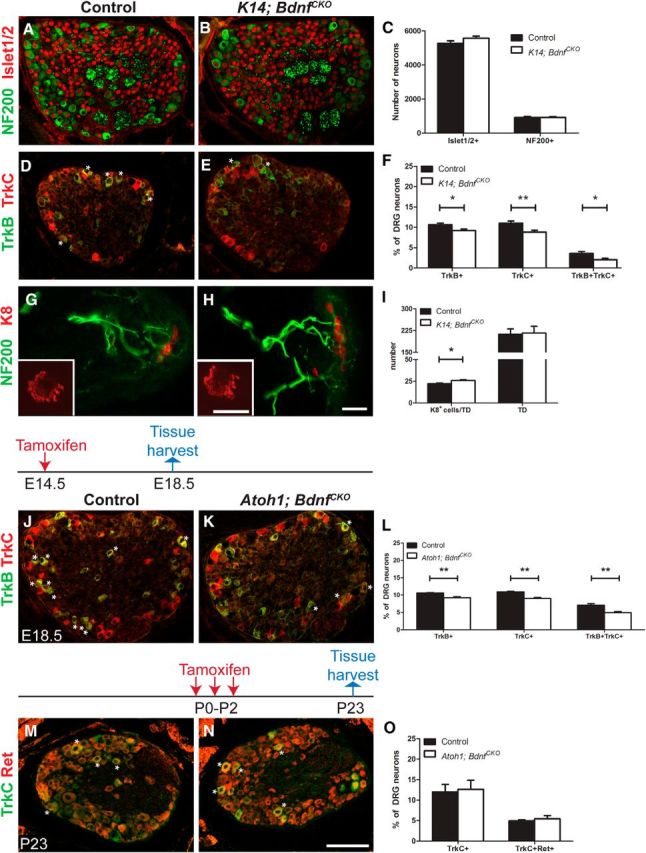
Figure 4.

Embryonic but not postnatal Merkel cell-derived BDNF is required for the proper expression of TrkB and TrkC in SAI neurons. A, B, D, E, Immunostaining for NF200/Islet1/2 (A, B) and TrkB/TrkC (D, E) in T7 DRG sections from P0 control and littermate K14; BdnfCKO mice. Asterisks indicate double-positive cells. G, H, NF200 and K8 immunostaining in dorsal skin sections from P0 control littermate and K14; BdnfCKO mice. Insets show single touch domes that were whole mount immunostained for K8. C, F, The numbers of Islet1/2+ and NF200+ neurons (C; n ≥ 10 mice/genotype) and the percentages of Islet1/2+ T7 DRG neurons expressing TrkB and TrkC (F; n ≥ 6 mice/genotype) in T7 DRG sections from P0 control and K14; BdnfCKO mice. I, Numbers of K8+ cells/touch dome (TD) and the density of touch domes/cm2 of skin (n = 3 mice/genotype). J–L, Immunostaining for TrkB and TrkC (J, K) and the percentage of Islet1/2+ T7 DRG neurons expressing TrkB and/or TrkC (L) in T7 DRG sections from E18.5 control and Atoh1; BdnfCKO mice treated with tamoxifen at E14.5 (n = 6 mice/genotype). M–O, Immunostaining for TrkC and Ret (M, N) and the percentage of Islet1/2+ T7 DRG neurons expressing TrkC and Ret (O) in T7 DRG sections from P23 control and Atoh1; BdnfCKO mice treated with tamoxifen from P0 to P2 (n = 3 mice/genotype). Tamoxifen dosing regimens are shown above J, K, M, and N. In photographs, asterisks indicate double-labeled cells. In graphs, error bars represent the SEM, and asterisks indicate statistically significant differences between genotypes. *p < 0.05; **p < 0.01. Scale bars: A, B, D, E, J, K, M, N, 100 μm; G, H, 120 μm; insets, 40 μm.
