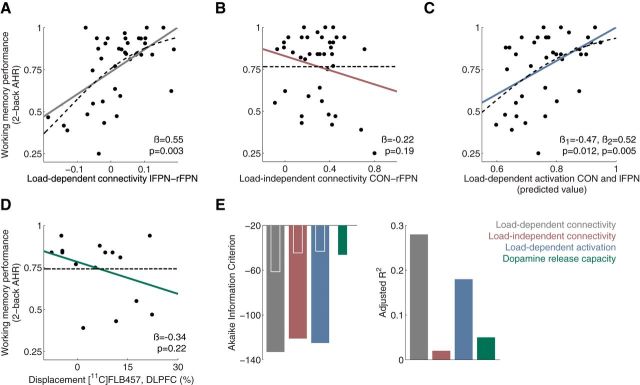
Figure 3.
A–D, Scatterplots indicating the relationship between working memory performance and different imaging measures in healthy individuals (n = 39). Solid lines represent linear fits and broken lines represent logistic fits. For each type of imaging measure, the best predictor or set of predictors were selected. The model in C includes two predictor variables and statistics are presented for both of them (β1 = CON; β2 = lFPN). E, Comparison of regression models presented in the scatterplots. According to both AIC and adjusted R2, load-dependent connectivity was the imaging measure which best predicted working memory performance This was also true if logistic fits were used (data not shown). AIC is shown for models including the full sample (broad bars) as well for models including only the subsample with data for dopamine-release capacity (inset, narrow bars).

