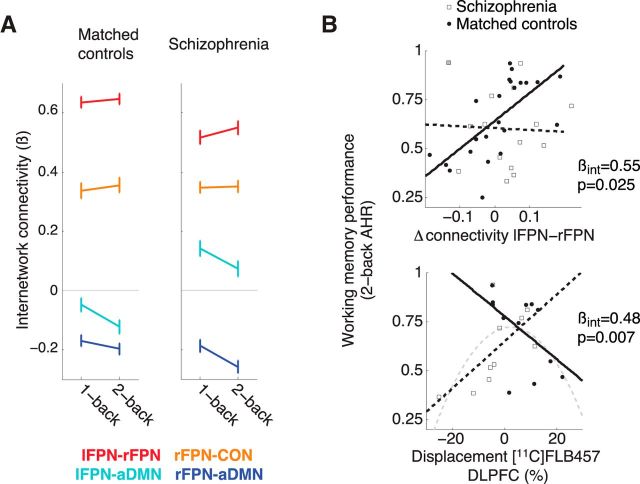
Figure 4.
Comparing individuals with schizophrenia to matched healthy controls. A, Load-dependent changes in internetwork connectivity did not significantly differ between patients (n = 15) and controls (n = 23; 4 of 6 network pairs shown). Consistent with well established evidence of abnormalities in intrinsic connectivity in schizophrenia, the figure indicates differences between the groups in load-independent connectivity (particularly between lFPN and aDMN). Post hoc analyses did not find load-independent connectivity to correlate to clinical or cognitive measures in patients. Error bars are 95% confidence intervals representing within-subjects variation (Cousineau, 2005). B, Top, Scatterplot indicating the relationship between working memory performance and load-dependent connectivity of frontoparietal networks in patients (broken line) and controls (solid line). In matched healthy controls working memory performance was greater in subjects with higher load-dependent connectivity of frontoparietal networks (β = 0.66, p = 0.001); however, this did not appear to be the case among individuals with schizophrenia (β = −0.04, p = 0.86). There was evidence that one patient (indicated by gray-filled square in top-left corner) was an influential outlier in this regression (Cook's distance = 0.49); however, the results of a robust regression confirmed that working memory performance was not dependent on load-dependent connectivity in patients. Bottom, Scatterplot indicating the relationship between working memory performance and dopamine release capacity in patients (n = 10) and matched controls (n = 12). The slopes of the regression lines relating working memory performance to dopamine release capacity were in opposite directions in patients (broken black line; β = 0.64, p = 0.046) and matched controls (solid black line; β = −0.63, p = 0.054). When combining the groups together, the relationship between these variables fit an inverted-U-shaped curve (broken gray line). βint, Standardized β for the interaction term of imaging measure by group.

