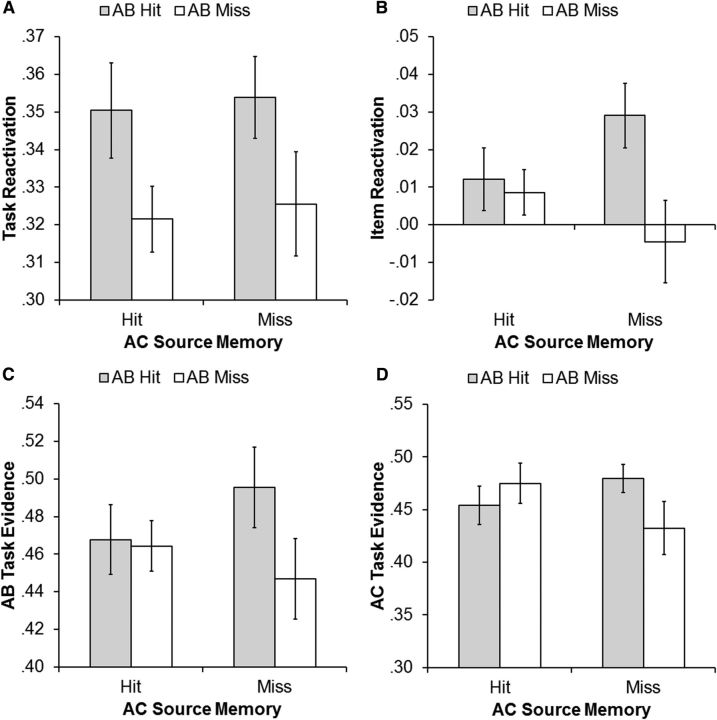
Figure 4.
A–D, Results from the subsequent source memory analysis of the four MVPA measures: task reactivation (A), item reactivation (B), AB task evidence at encoding (C), and AC task evidence at encoding (D). Each panel depicts the across-participant average of the relevant MVPA metric for the four cells formed by treating subsequent source memory for the AB and AC encoding tasks as separate factors. Error bars represent ±1 SEM.

