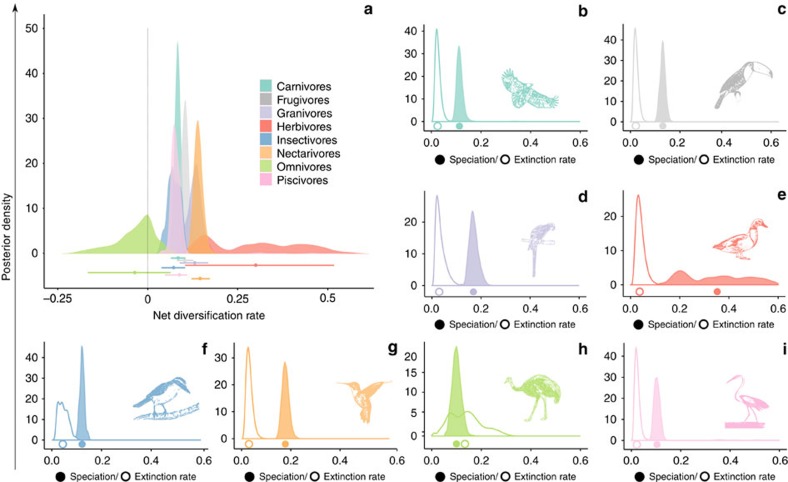
Figure 1. Diversification rates associated with different bird dietary guilds.
(a) Posterior distributions of net diversification rates for each dietary guild and (b–i) corresponding posterior distributions of speciation and extinction rates. Bars on a represent the 95% CI of each distribution and the dots the median of the posterior distribution. In b–i colour-filled curves represent speciation rates and white-filled curves represent extinction rates. The filled and empty dots represent median values for speciation and extinction rates, respectively.

