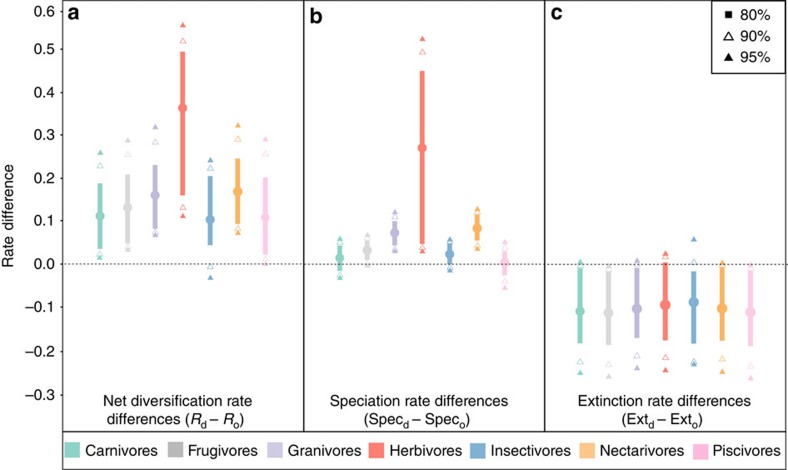
Figure 2. Distinct diversification dynamics associated with omnivory in birds.
Differences between net diversification (a), speciation (b) and extinction (c) of all dietary guilds relative to omnivores. The differences in rates are calculated by incorporating phylogenetic uncertainty and therefore represent a posterior distribution of differences between the rate estimates of each guild compared with the rate estimate of omnivores. The thick lines, filled and hollow triangles indicate different credibility intervals, and the dashed line indicates 0 (no difference). Positive values mean that the considered rate is higher for each guild than the same rate for omnivores. Omnivores generally show lower speciation and higher extinction rates, although differences are significant at different degrees of credibility depending on the guild.

