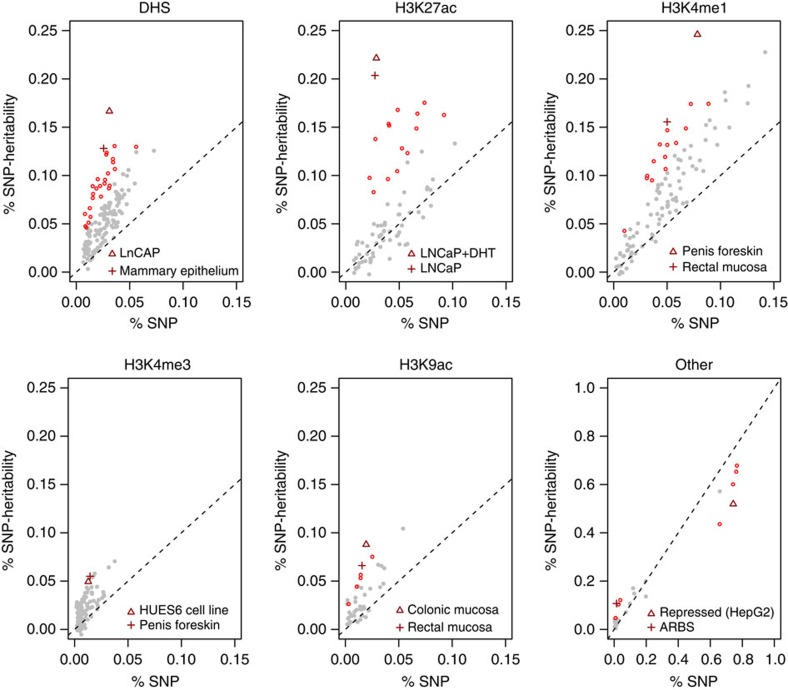
Figure 2. Functional partitioning of heritability across six main epigenetic classes.
Each point corresponds to an estimate of % SNP heritability (y axis) from SNPs within a cell-type-specific functional annotation versus annotation size (%SNPs, x axis). Overall, 544 annotations were tested, and red points indicate significant deviations from the null of  equal to %SNPs after accounting for all tests. The two most significant annotations in each class are shown with triangle/cross, respectively, and labelled in bottom right (see Supplementary Data for all annotations).

