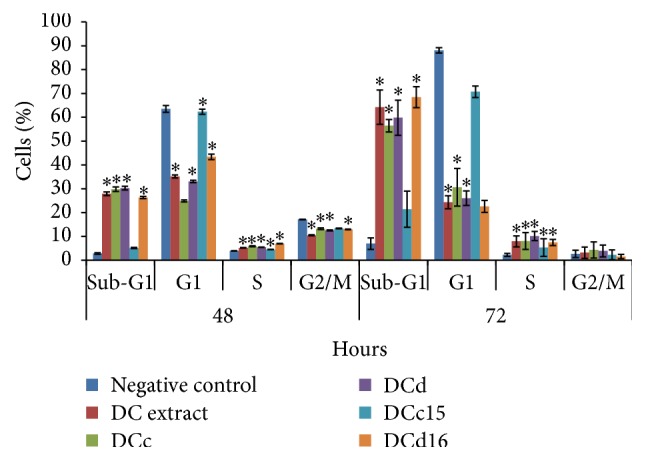
Figure 7.

Flow cytometric analysis of cell cycle distribution in H400 cells. H400 cells were treated with DC extract, fractions DCc and DCd, and subfractions DCc15 and DCd16 of D. cinnabari at concentration of IC50 for 48 and 72 hours. Untreated cells were used as negative control. Data was shown as mean ± SEM. ∗Significant difference as compared to negative control (p < 0.05) when statistical analysis was performed.
