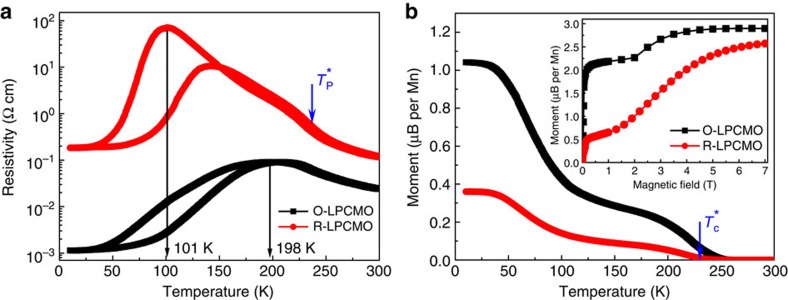
Figure 2. Transport and magnetic properties of O-LPCMO and R-LPCMO films.
(a) Temperature-dependent resistivity measurement at zero magnetic field. (b) Temperature-dependent magnetization measurement at 100 Gs. The insert shows the initial magnetization curves measured at 10 K after cooling from room temperature under zero magnetic field, indicating that O-LPCMO has much higher FMM volume fraction than that of the R-LPCMO.  and
and  , with blue arrow symbols indicating the Curie temperature and MIT temperature in bulk LPCMO.

