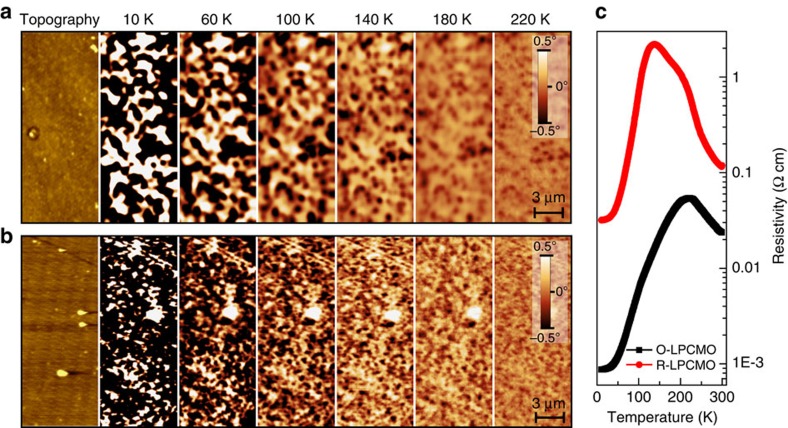
Figure 3. MFM images of R-LPCMO and O-LPCMO.
Temperature-dependent MFM images of (a) R-LPCMO and (b) O-LPCMO under 1 T field cooling (the magnetic field was applied perpendicular to sample surface). Scanning areas are 7 × 14 μm. The negative signal indicates FMM state, while positive signal is AFM-CO state. The AFM morphological images are measured from the same area as the MFM scan. (c) Temperature-dependent resistivity measured under 1 T field cooling.

