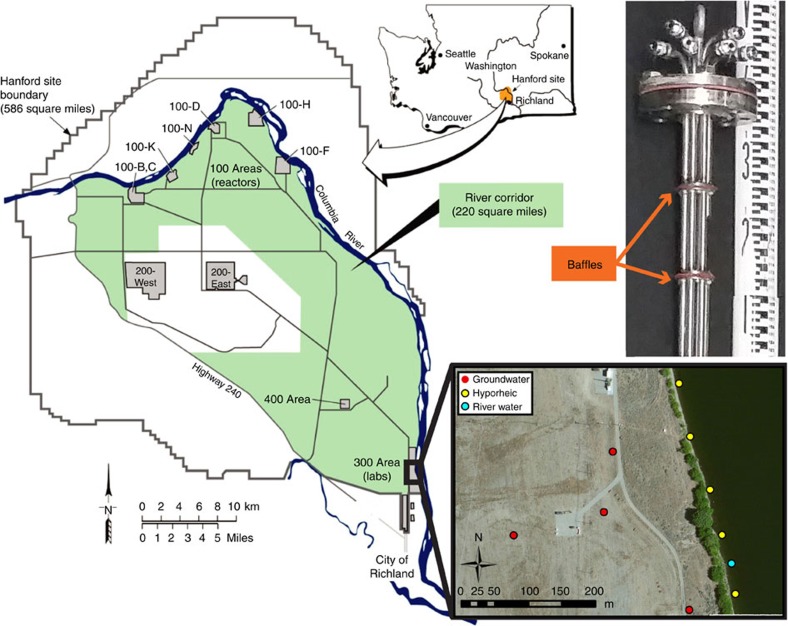
Figure 1. Sampling locations and infrastructure.
Map showing sampling locations in the Hanford 300 Area. Also displayed is the top 30 cm of the multi-level sampling device used to sample riverbed piezometers; baffles separating vertical zones are noted; tubes for water collection were terminated within each vertical interval.

