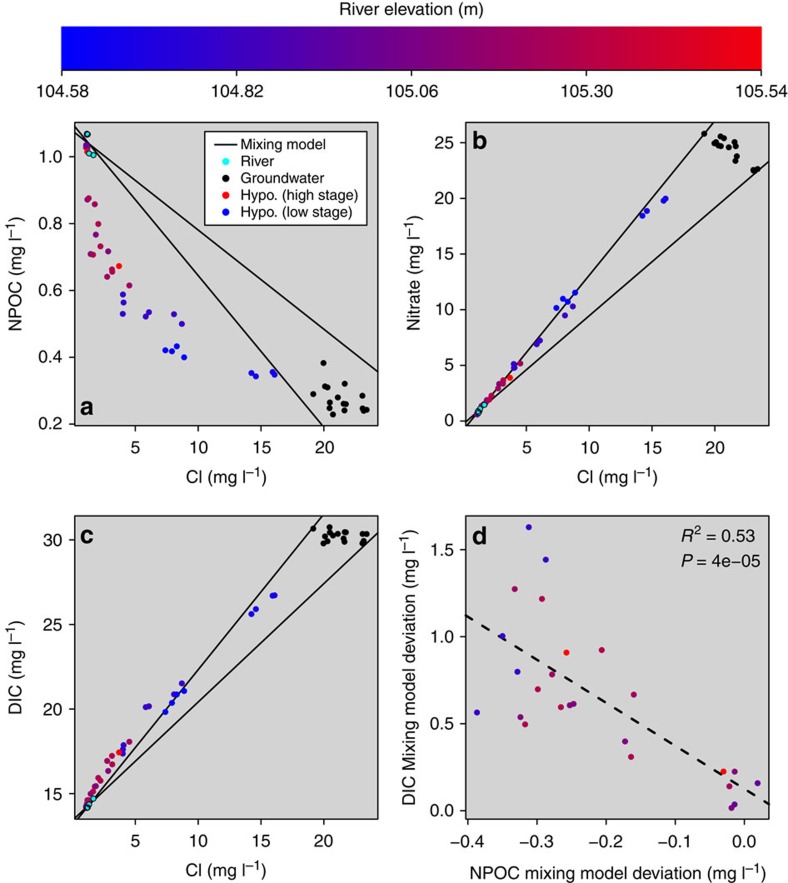
Figure 3. Solutes and associated mixing models.
(a–c) Dissolved solutes as a function Cl− concentration with mixing model expectations indicated by solid lines. DIC, dissolved inorganic carbon; NPOC, non-purgable organic carbon. (d) Deviation from the upper/steeper DIC mixing model as a function of the deviation from the lower/steeper NPOC mixing model. To focus on positive DIC deviations, data points were restricted to Cl−<7 mg l−1. Linear model (dashed line) statistics are provided. In all panels, river stage at the time of sample collection in the hyporheic zone is indicated by a gradient from blue (low river stage) to red (high river stage); values corresponding to colours are provided in the colour bar.

