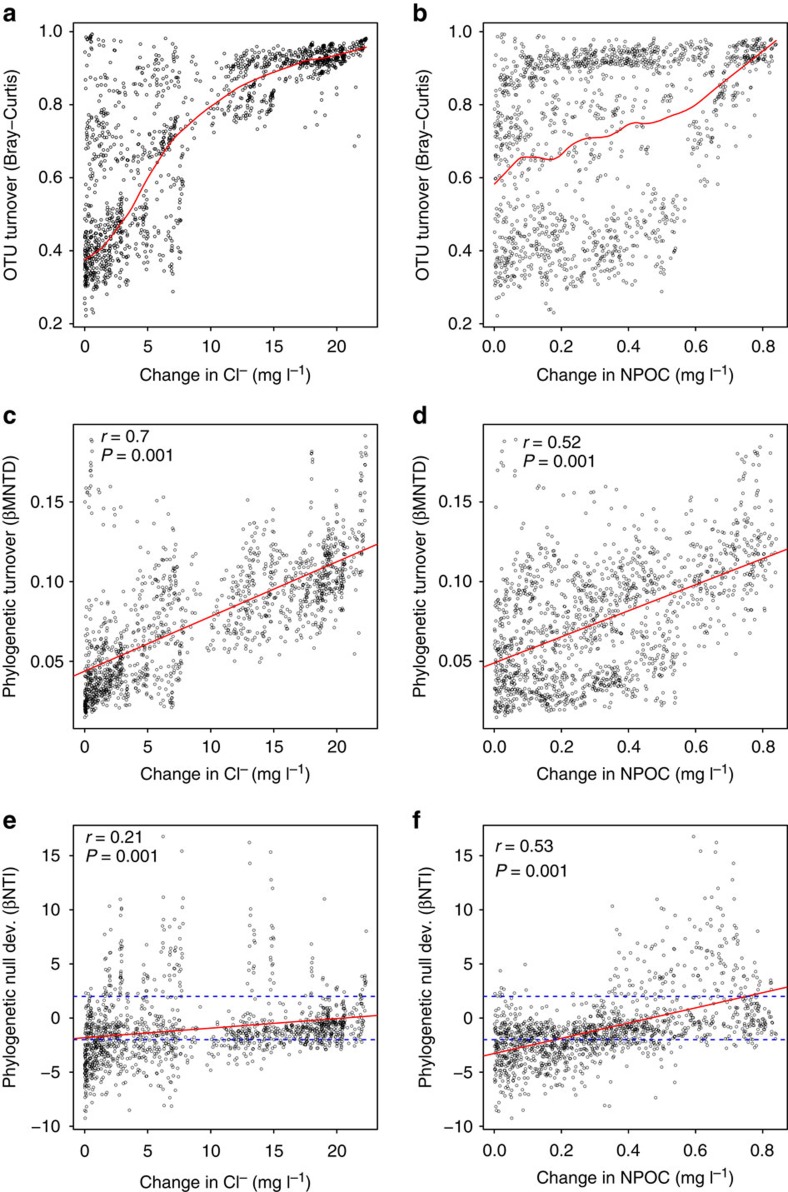
Figure 5. Turnover in microbial community composition.
Microbial community turnover in terms of composition (a,b), phylogeny (c,d) and phylogenetic null model deviation (e,f). Turnover metrics are related to either changes in Cl− (a,c,e) or changes in NPOC (b,d,f). Solid red lines indicate a nonlinear spline fit (a,b) or linear models (c–f); dashed blue lines (e,f) indicate null model deviation significance thresholds; values above +2 or below −2 are considered significant. Mantel test statistics are provided.

