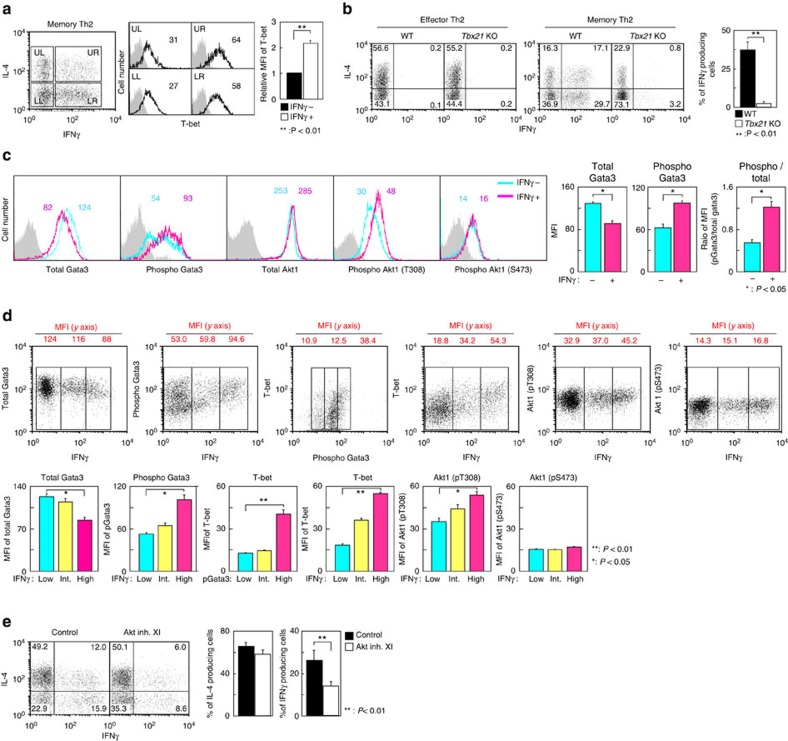
Figure 6. Increased phosphorylation status of Gata3 and Akt1 in IFNγ-producing memory Th2 cells.
(a) Memory Th2 cells were stimulated with PMA plus ionomycin for 6 h. The cells were divided into four distinct subpopulations according to their expression of IL-4 and IFNγ (left). Intracellular staining profiles of T-bet in these four subpopulations are shown (middle). The number in the histogram represents the MFI. The grey-filled histogram shows isotype control staining. A summary of the MFI of T-bet in IFNγ-producing and -nonproducing cells is presented (right) (n=5). (b) Intracellular staining profiles of IFNγ and IL-4 in effector and memory Th2 cells from WT or Tbx21-deficient mice are shown with the percentages of cells in each area (left). A summary of the percentage of IFNγ-producing memory Th2 cells is presented (right) (n=3). (c) Intracellular staining profiles of Gata3, phospho-Gata3, Akt1 and phospho-Akt1 in IFNγ-producing and -nonproducing memory Th2 cells are shown (left). A summary of the MFI value of Gata3 and phospho-Gata3 and the ratio of the MFI (phospho-Gata3/total Gata3) in IFNγ-producing and IFNγ-nonproducing memory Th2 cells is presented (right) (n=5). (d) Intracellular staining profiles of IFNγ, Gata3, phospho-Gata3, T-bet and phospo-Akt1 are shown. The number represents the MFI of the y axis in each area (top). A summary of the MFI in each area (IFNγ: Low, Int, High) is presented (bottom) (n=5). (e) Memory Th2 cells were cultured in IL-7-containing medium with or without Akt inhibitor XI (10 μM) for 2 days. Intracellular staining profiles of IFNγ and IL-4 are shown (left). A summary of the percentage of IL-4- and IFNγ-producing memory Th2 cells is presented (right) (n=4). **P<0.01, *P<0.05 by Student's t-test. Five (a), four (e) and three (b,c,d) independent experiments were performed with similar results.

