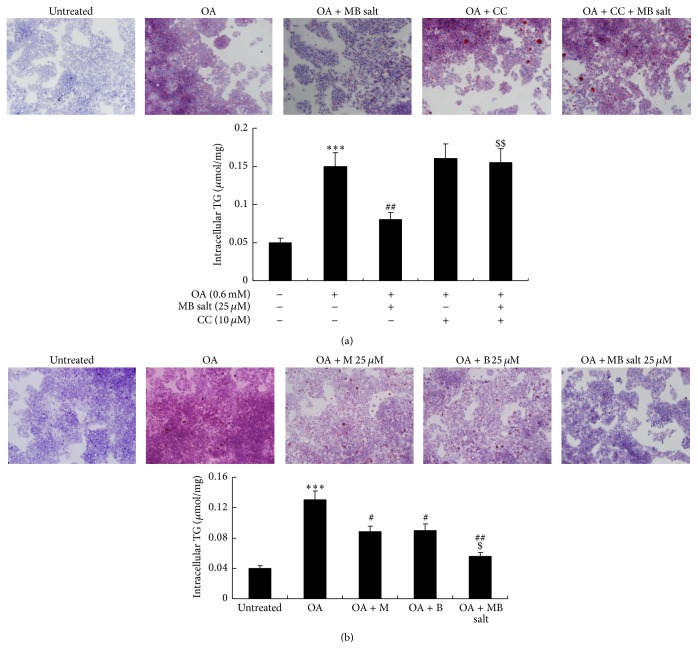
Figure 4.
Effects of MB salt on OA-induced steatosis and TG accumulation. (a) HepG2 cells were left untreated or pretreated with CC for 30 min; then the cells were again left untreated or treated with OA or OA + MB salt as indicated. 24 h later, cells were used for ORO staining (upper panel) or harvested for intracellular TG assay (lower panel). Representative pictures are presented. Values are mean ± SD of 4 separate experiments; ∗∗∗ p < 0.001 versus that of untreated cells; ## p < 0.01 versus that of OA alone; $$ p < 0.01 versus that of OA + MB salt. (b) Cells were left untreated or treated with OA and an equal concentration of MB salt/M/B as indicated for 24 h. Then, cells were used for ORO staining (upper panel) or intracellular TG assay (lower panel). Representative pictures are presented. Values are mean ± SD of 4 separate experiments; ∗∗∗ p < 0.001 versus that of untreated cells; # p < 0.05 and ## p < 0.01 versus that of OA alone; $ p < 0.05 versus that of OA + M or OA + B.

