Figure 1.

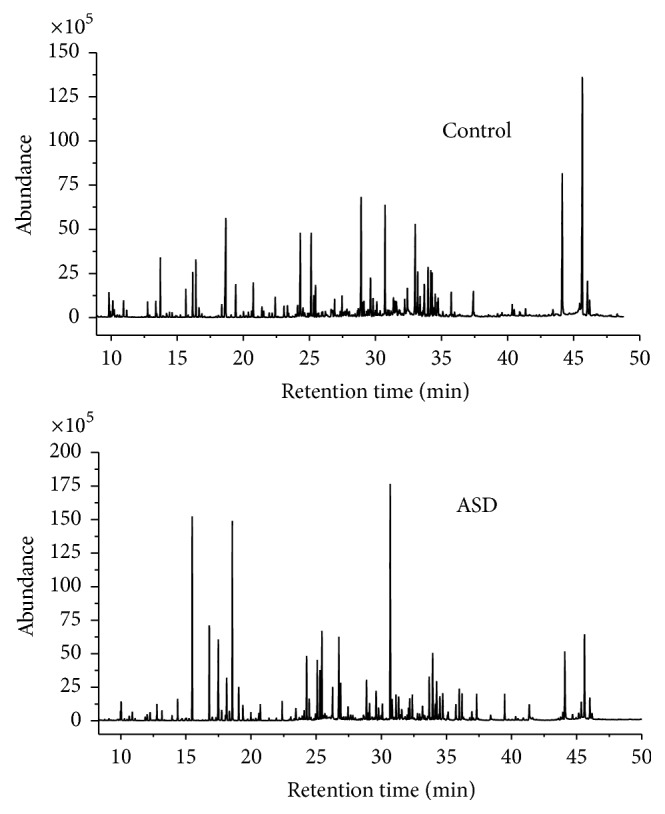
Representative GC/MS total ion chromatograms of the samples from the control group and the ASDs group after chemical derivatization.

Representative GC/MS total ion chromatograms of the samples from the control group and the ASDs group after chemical derivatization.